Plot Catalog
EvilPlot examples both simple and built-in as well as complex and custom are here. If you have one you’d like to share, please contribute it!
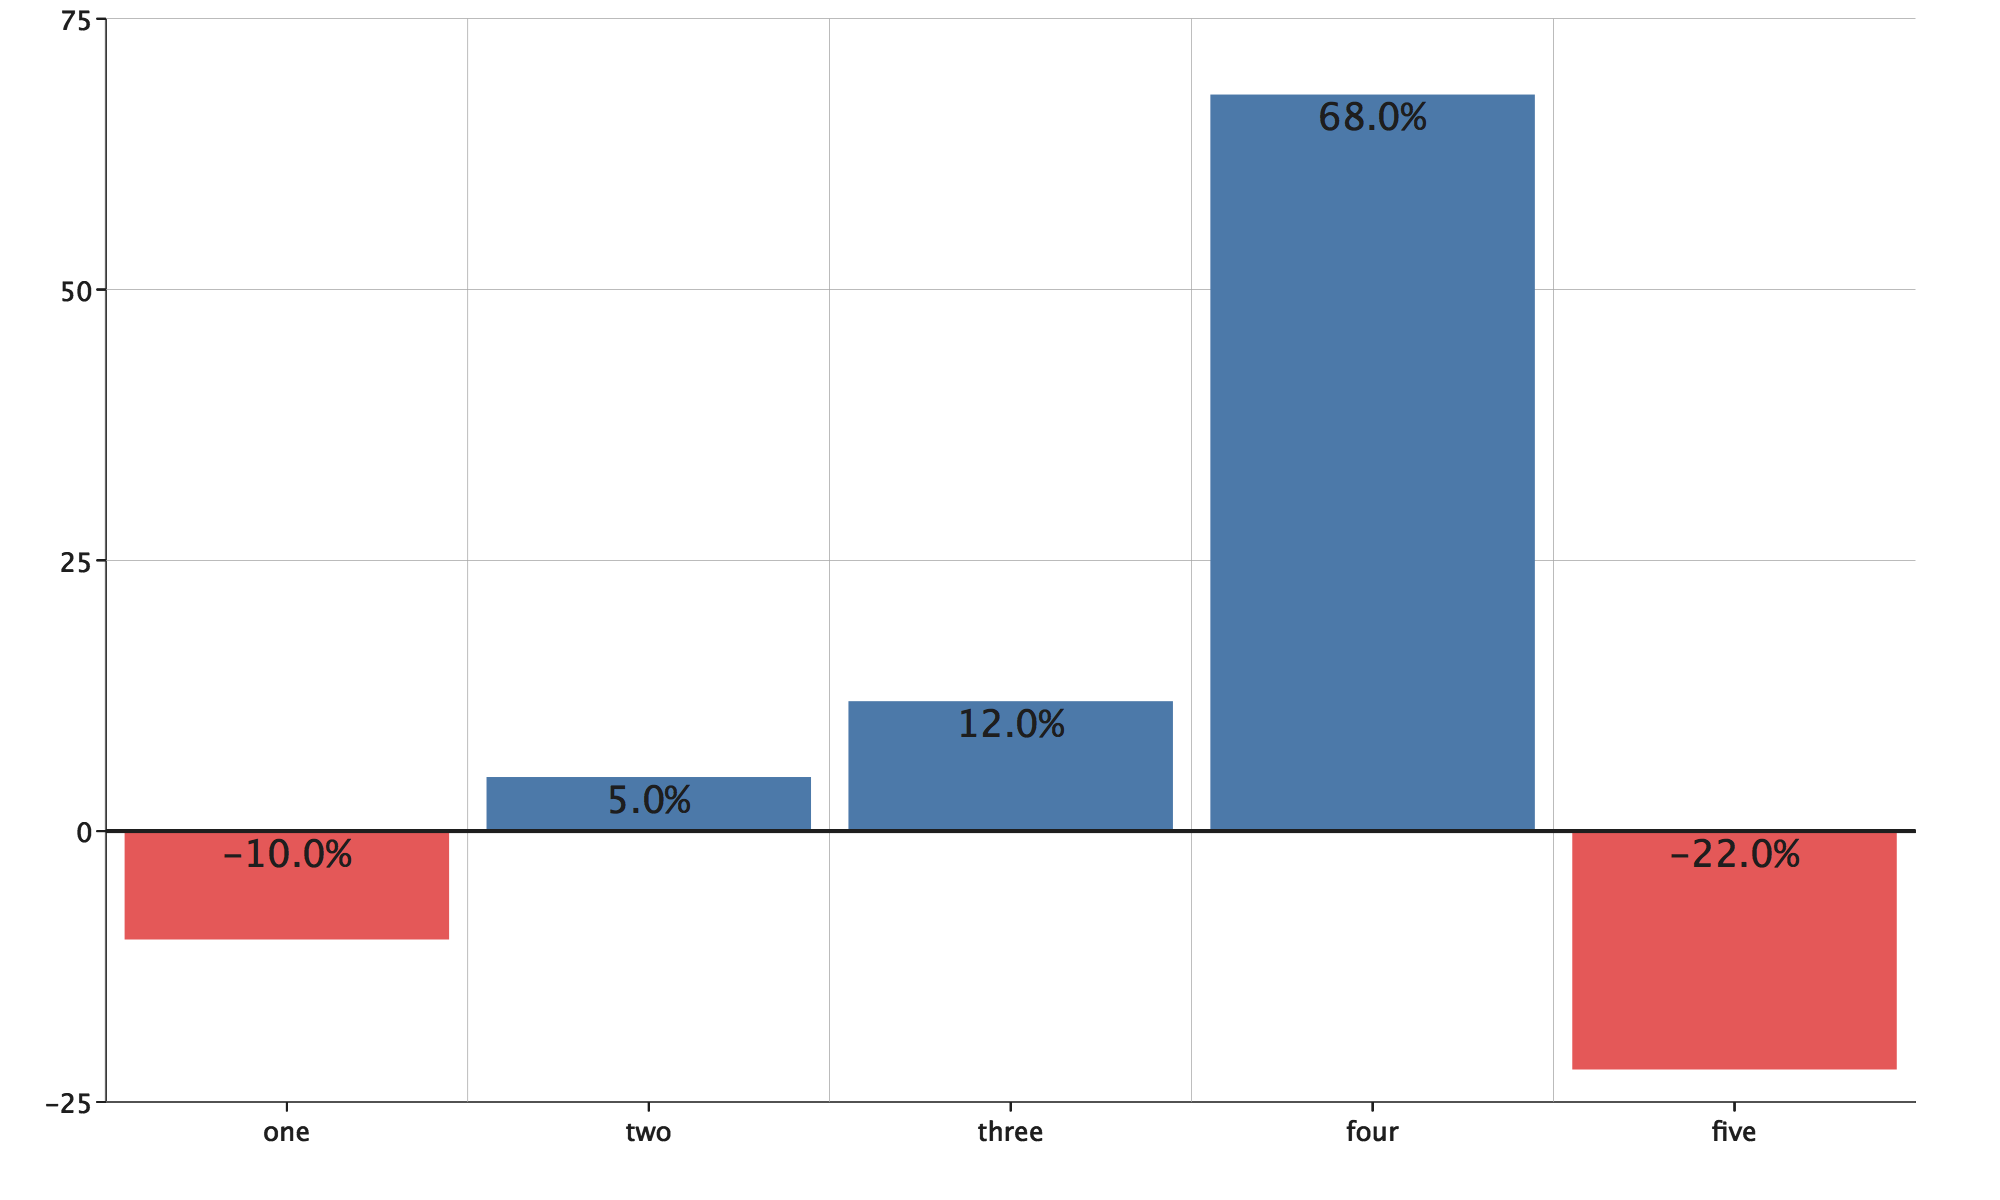
Bar Chart
import com.cibo.evilplot.colors.RGB
import com.cibo.evilplot.geometry.{Align, Drawable, Extent, Rect, Text}
import com.cibo.evilplot.plot._
import com.cibo.evilplot.plot.aesthetics.DefaultTheme.{DefaultFonts, DefaultTheme}
import com.cibo.evilplot.plot.renderers.BarRenderer

implicit val theme: DefaultTheme = DefaultTheme().copy(
  fonts = DefaultFonts()
    .copy(tickLabelSize = 14, legendLabelSize = 14, fontFace = "'Lato', sans-serif")
)

val percentChange = Seq[Double](-10, 5, 12, 68, -22)
val labels = Seq("one", "two", "three", "four", "five")

val labeledByColor = new BarRenderer {
  val positive = RGB(241, 121, 6)
  val negative = RGB(226, 56, 140)
  def render(plot: Plot, extent: Extent, category: Bar): Drawable = {
    val rect = Rect(extent)
    val value = category.values.head
    val color = if (value >= 0) positive else negative
    Align.center(rect filled color, Text(s"$value%", size = 20)
     .filled(theme.colors.label)
    ).group
  }
}

BarChart
  .custom(percentChange.map(Bar.apply), spacing = Some(20),
    barRenderer = Some(labeledByColor)
  )
  .standard(xLabels = labels)
  .hline(0)
  .render()
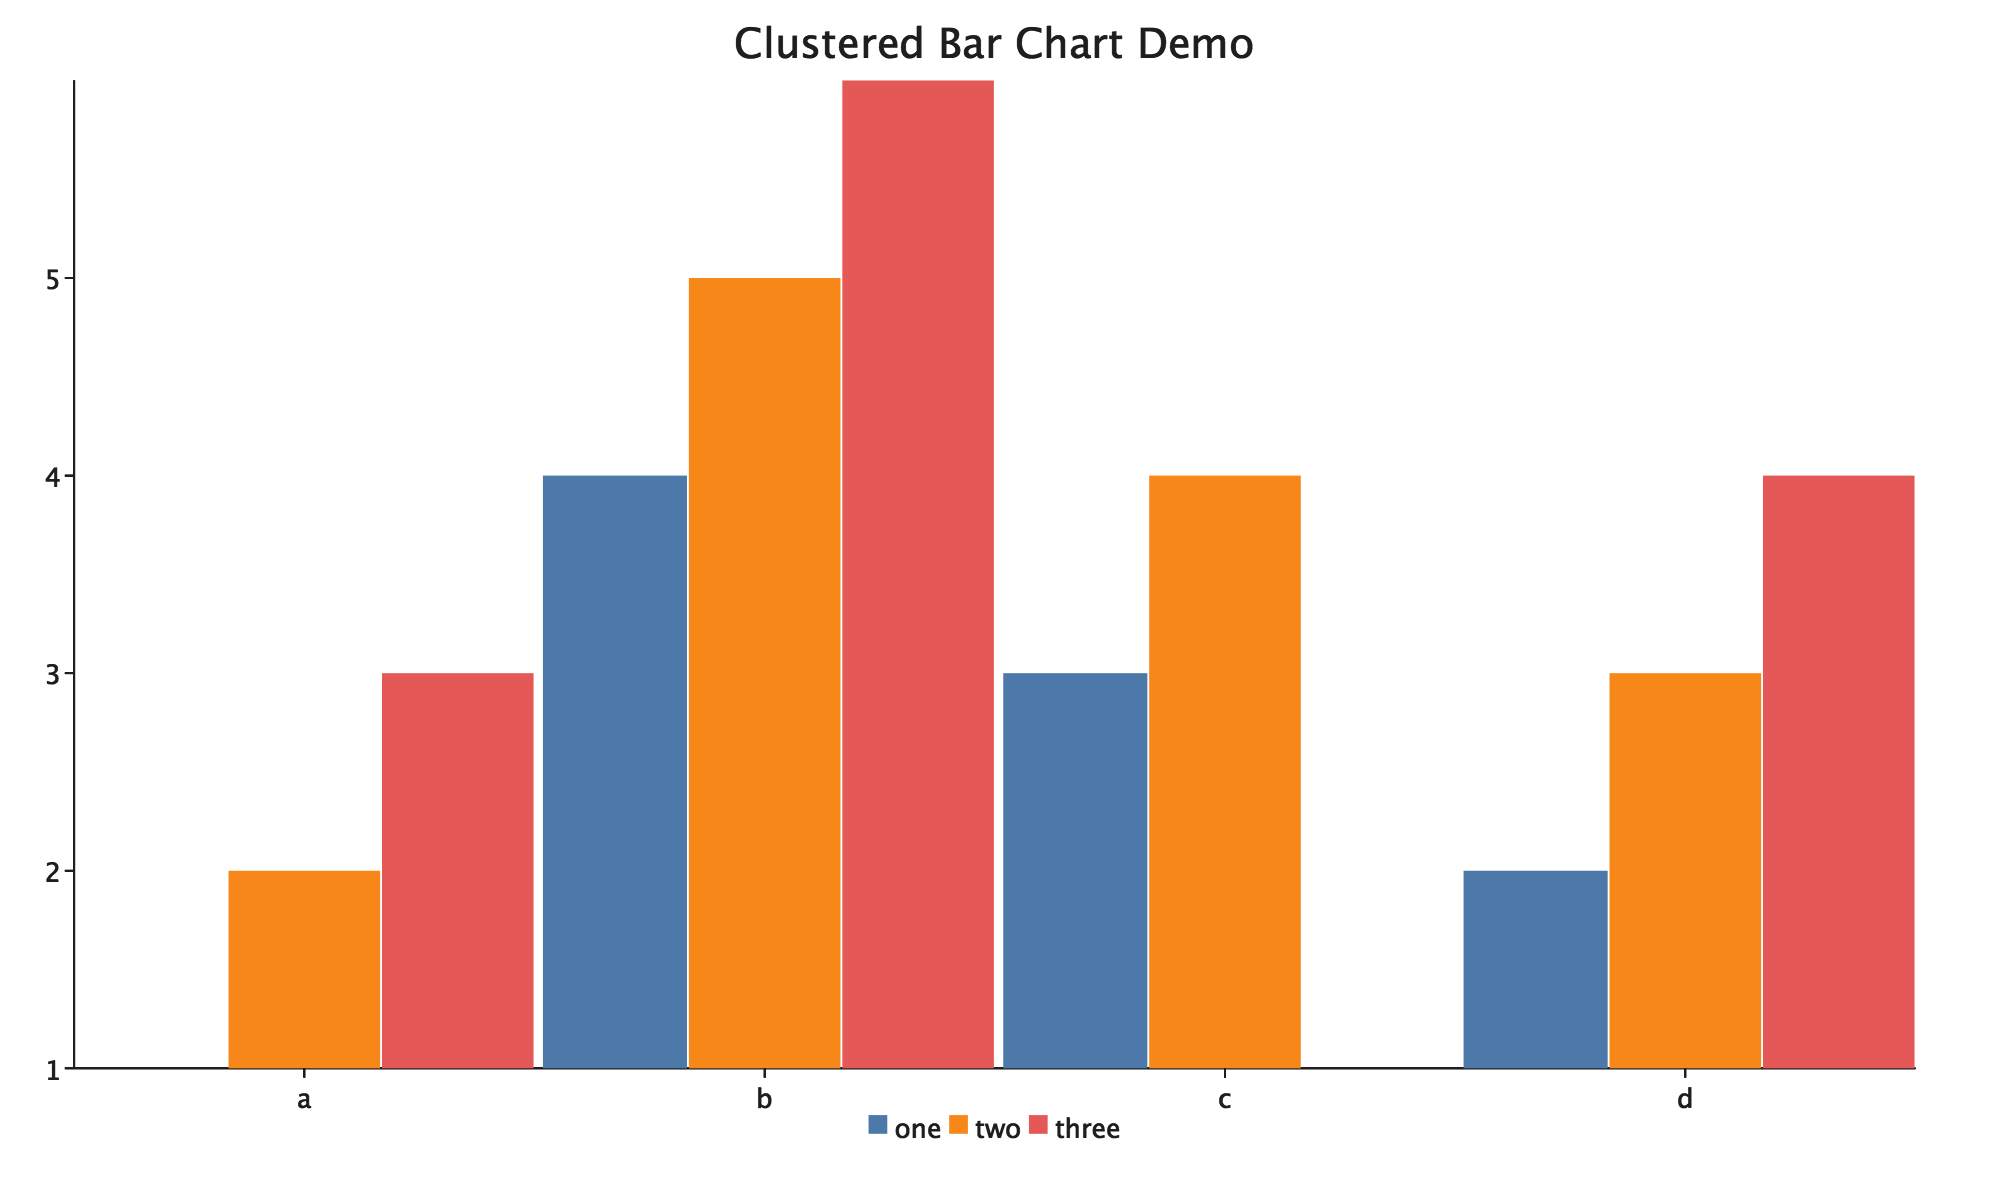
Clustered Bar Chart
import com.cibo.evilplot.plot._

val data = Seq[Seq[Double]](
Seq(1, 2, 3),
Seq(4, 5, 6),
   Seq(3, 4, 1),
   Seq(2, 3, 4)
 )
 BarChart
   .clustered(
     data,
     labels = Seq("one", "two", "three")
   )
   .title("Clustered Bar Chart Demo")
   .xAxis(Seq("a", "b", "c", "d"))
   .yAxis()
   .frame()
   .bottomLegend()
   .render()
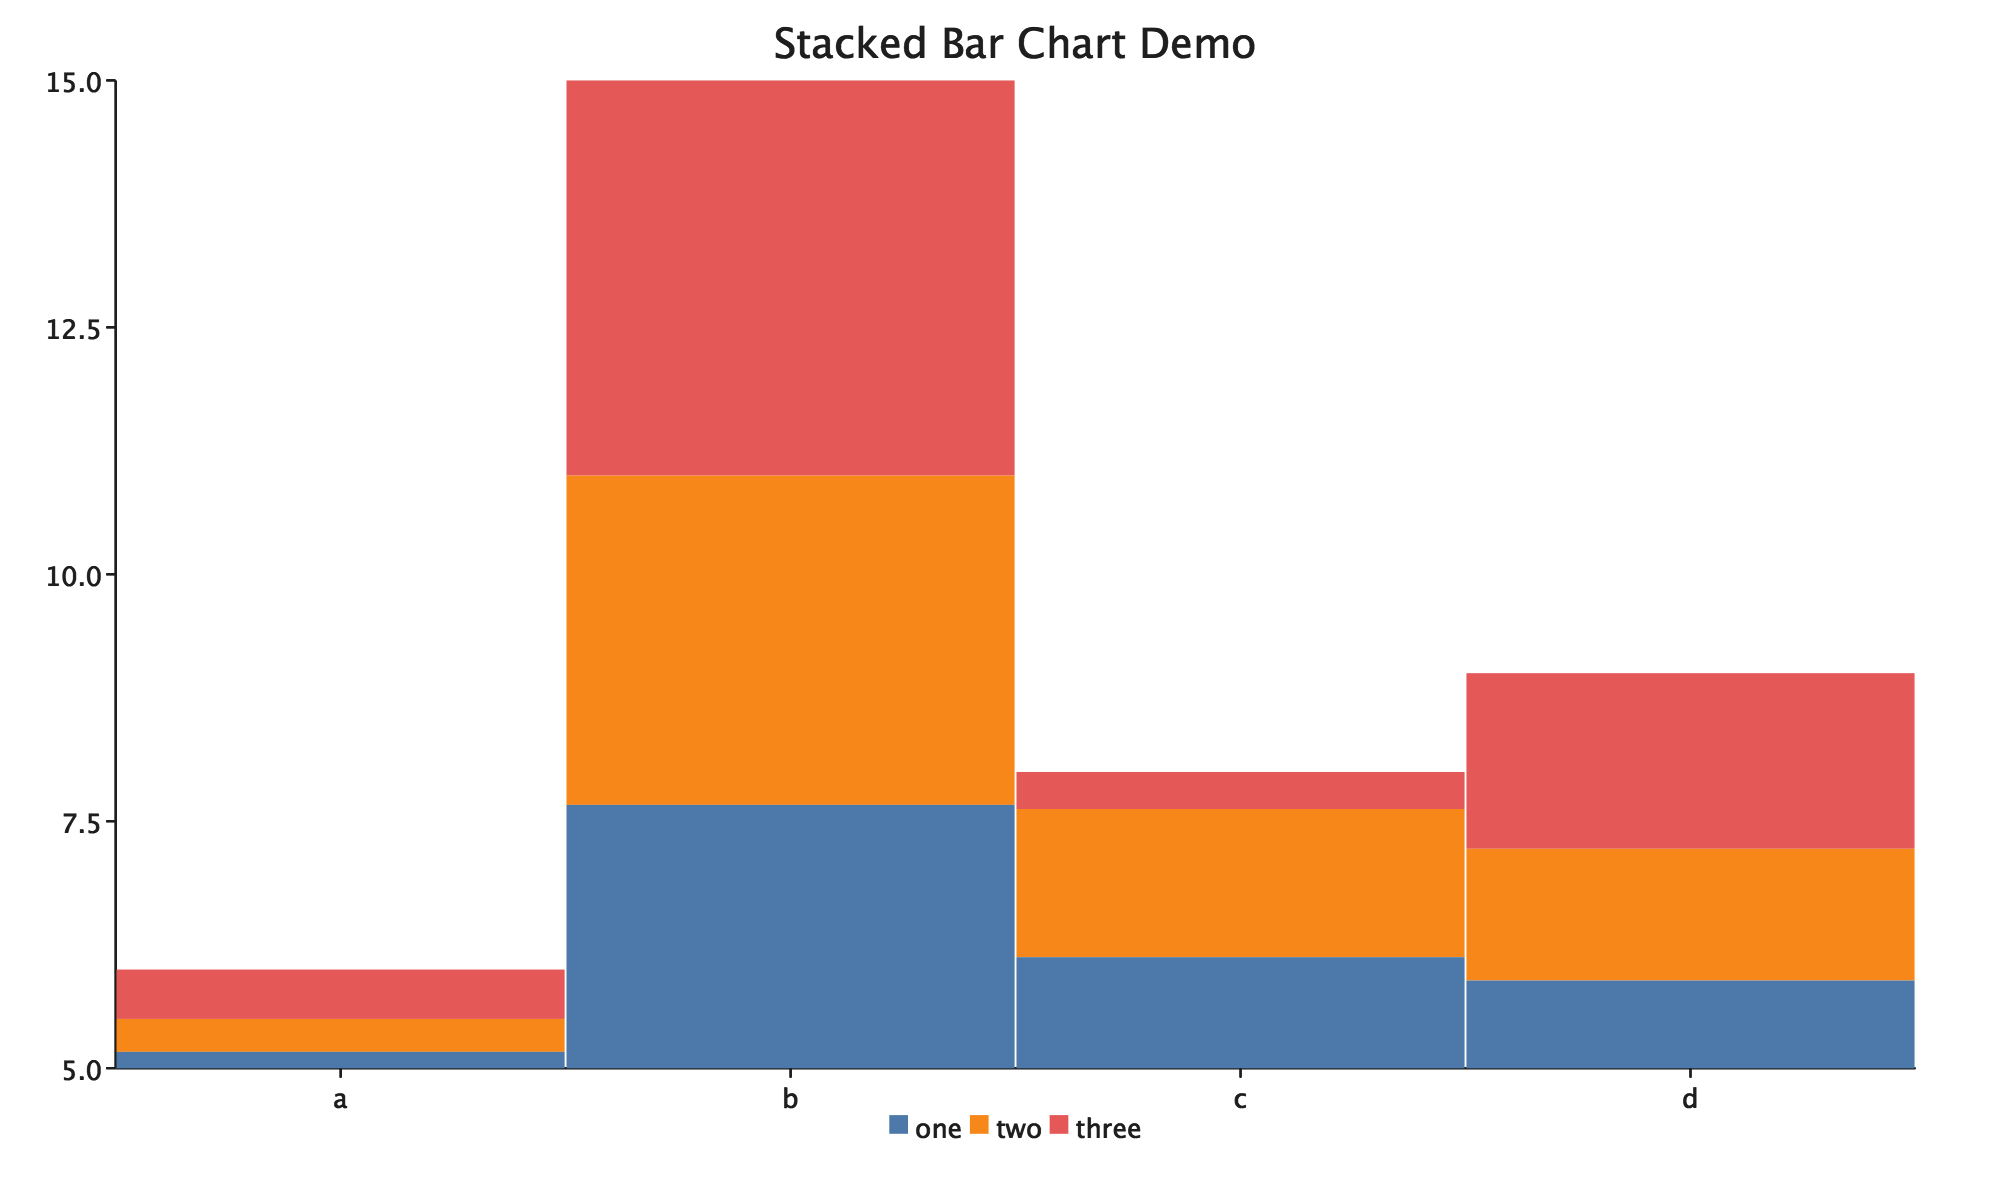
Stacked Bar Chart
import com.cibo.evilplot.plot._

val data = Seq[Seq[Double]](
  Seq(1, 2, 3),
  Seq(4, 5, 6),
  Seq(3, 4, 1),
  Seq(2, 3, 4)
)
BarChart
  .stacked(
    data,
    labels = Seq("one", "two", "three")
  )
  .title("Stacked Bar Chart Demo")
  .xAxis(Seq("a", "b", "c", "d"))
  .yAxis()
  .frame()
  .bottomLegend()
  .render()
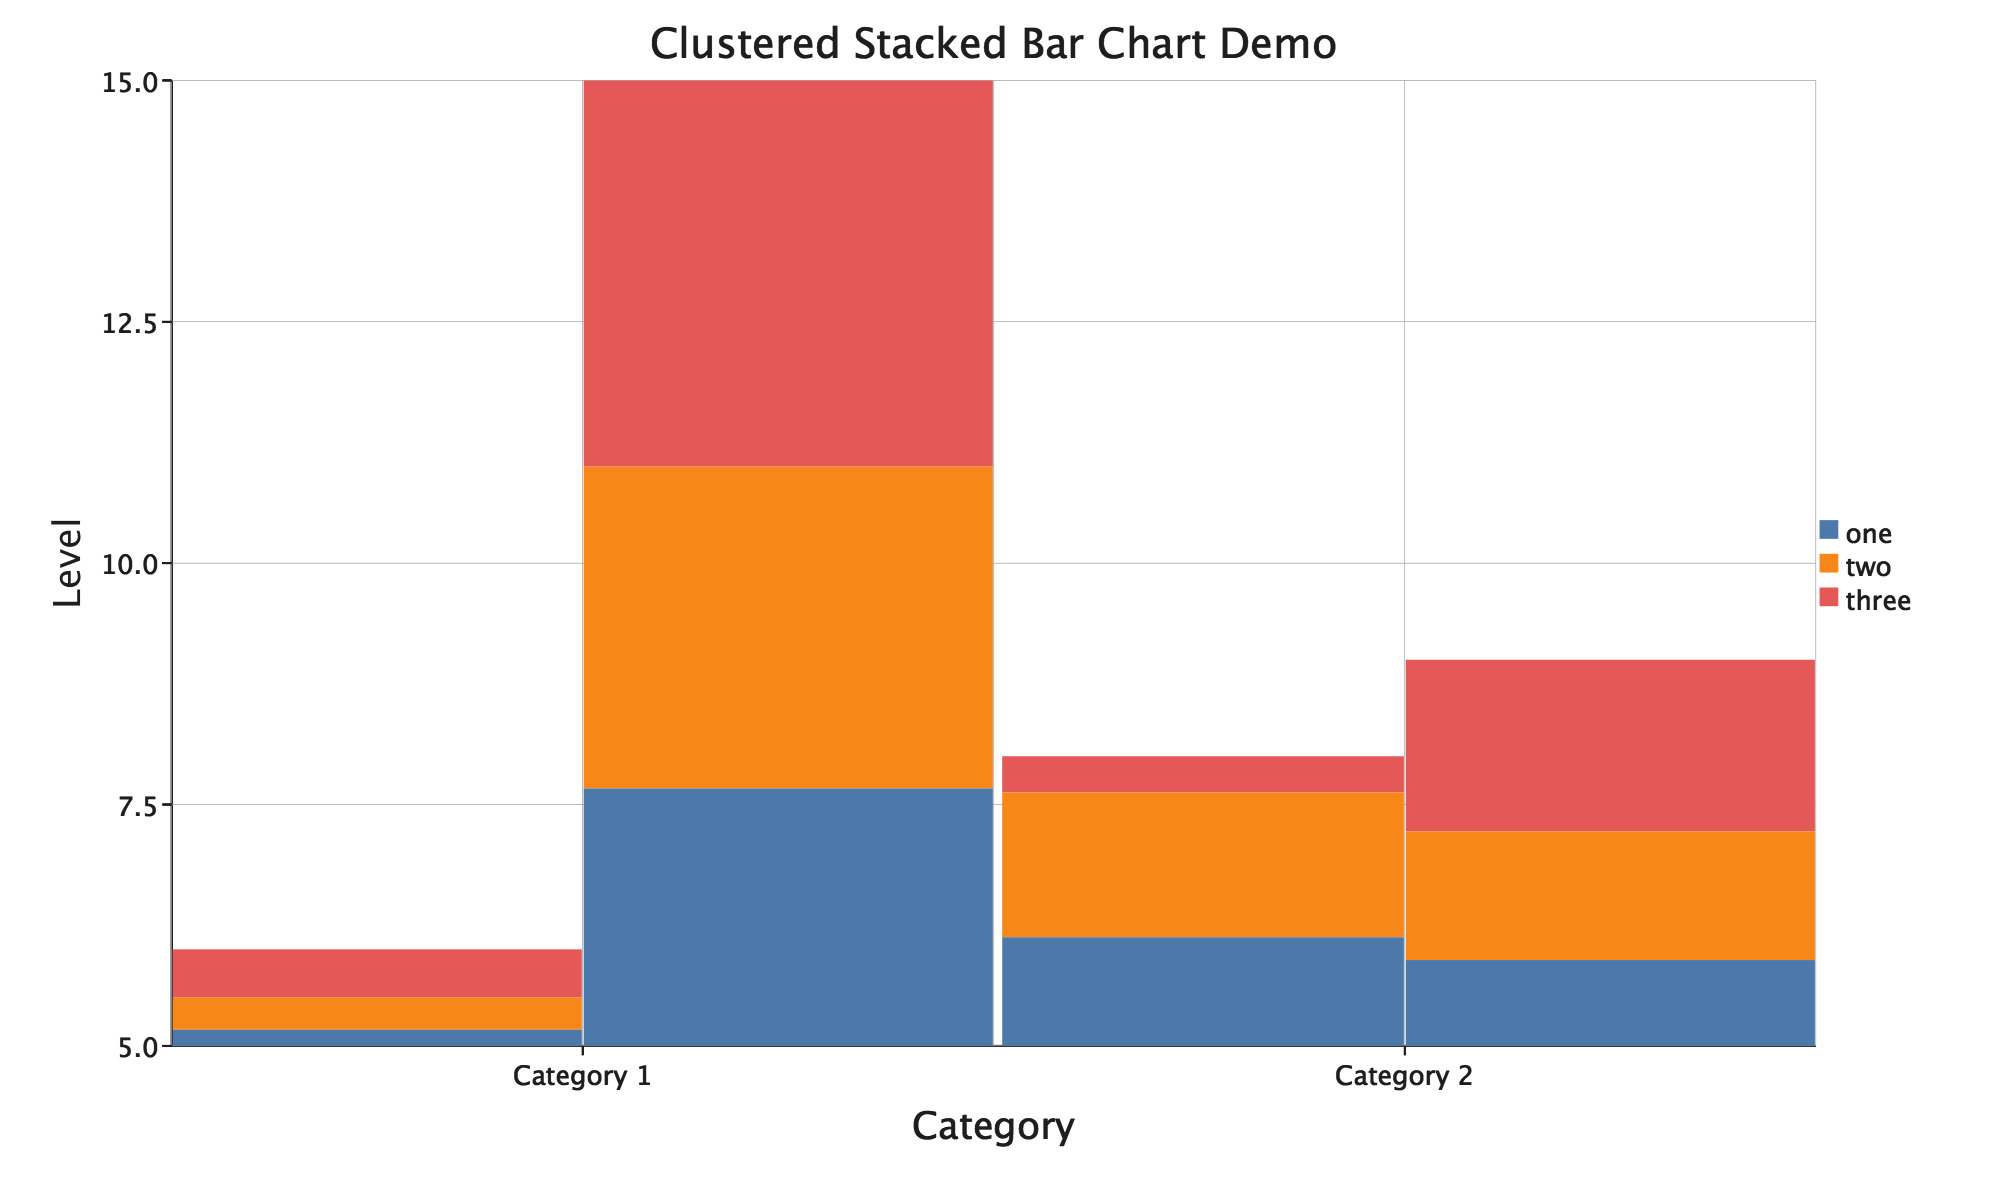
Clustered Stacked Bar Chart
import com.cibo.evilplot.plot._

val data = Seq[Seq[Seq[Double]]](
  Seq(Seq(1, 2, 3), Seq(4, 5, 6)),
  Seq(Seq(3, 4, 1), Seq(2, 3, 4))
)
BarChart
  .clusteredStacked(
    data,
    labels = Seq("one", "two", "three")
  ).title("Clustered Stacked Bar Chart Demo")
  .standard(Seq("Category 1", "Category 2"))
  .xLabel("Category")
  .yLabel("Level")
  .rightLegend()
  .render()
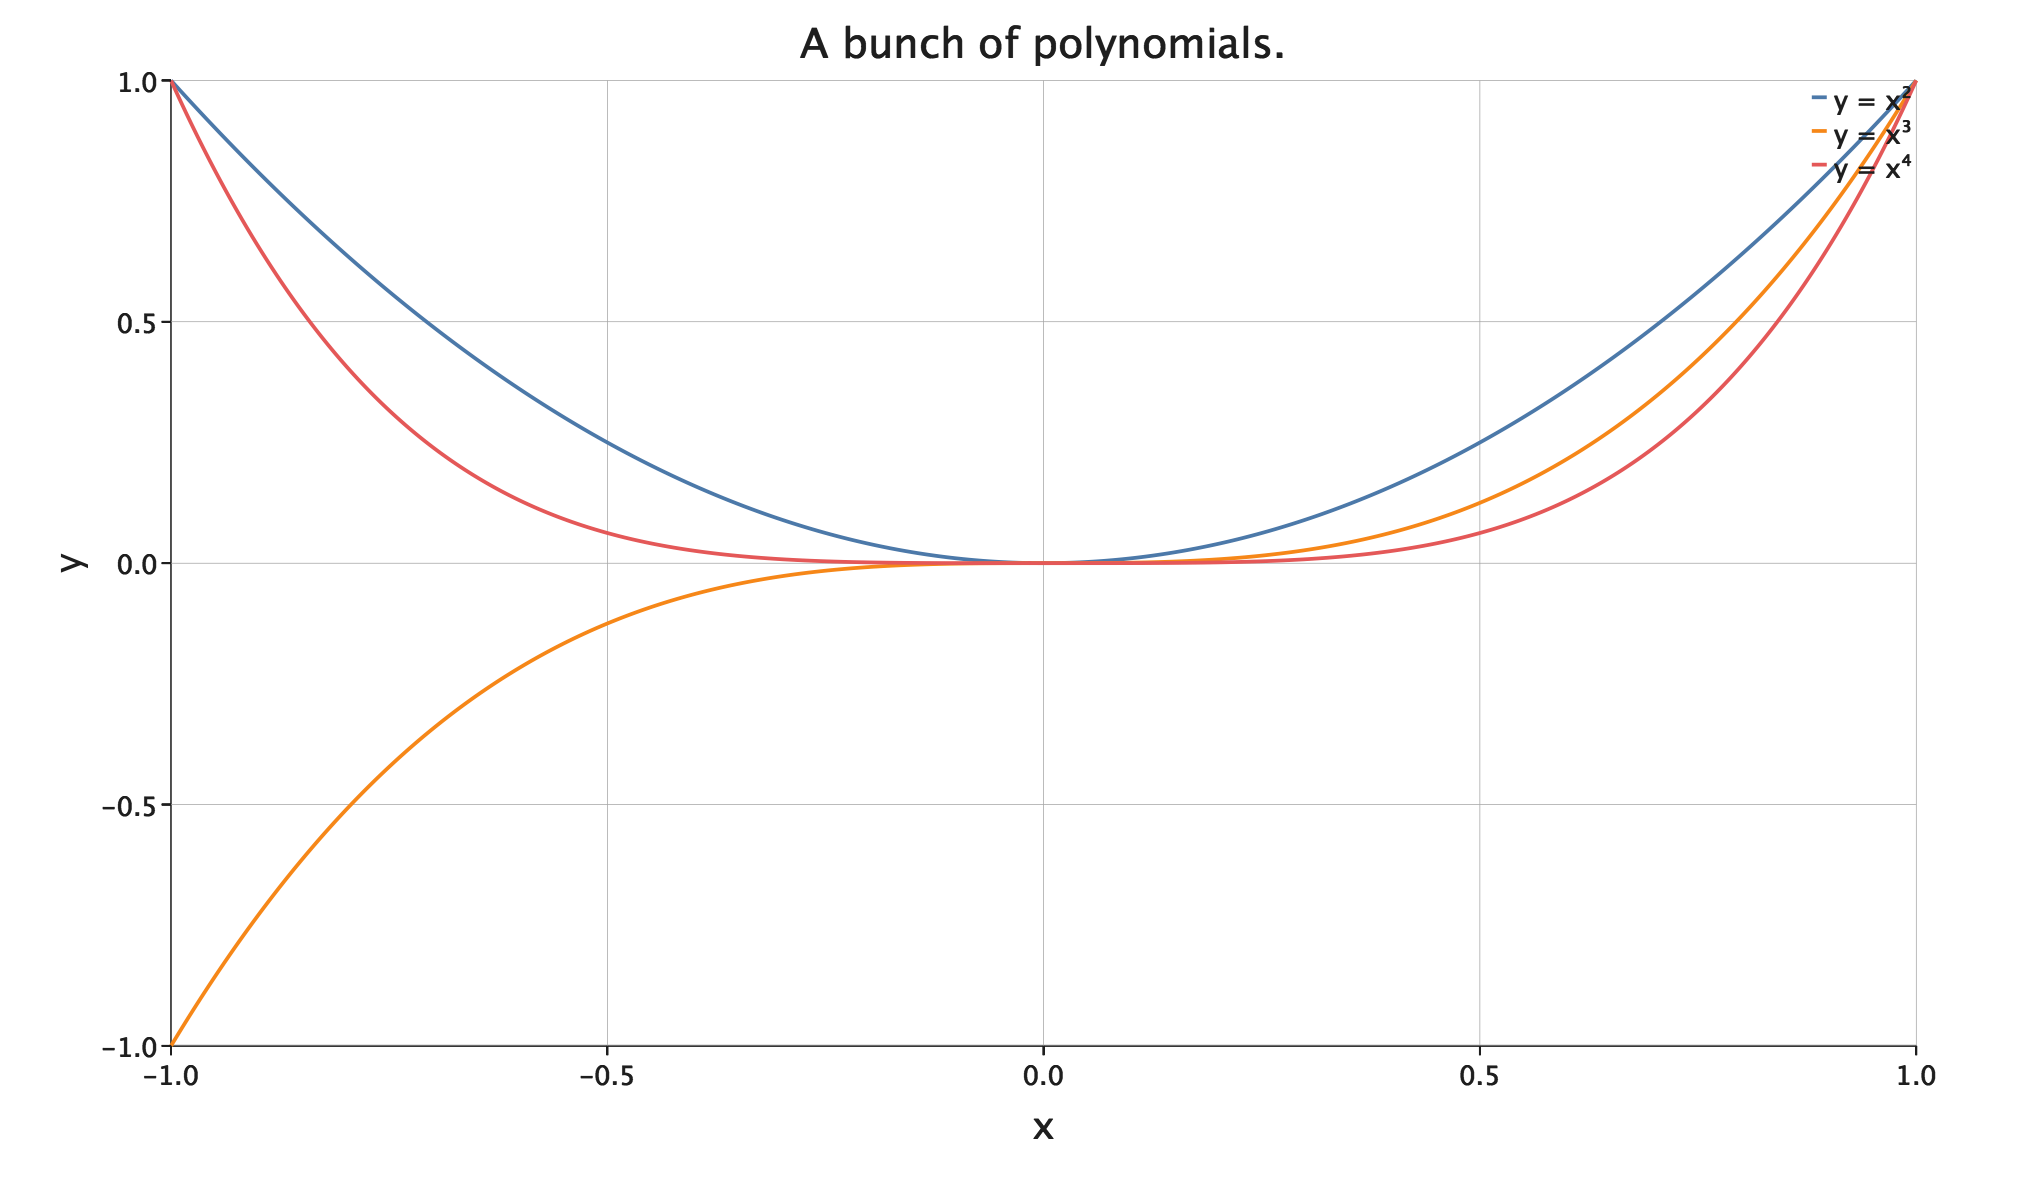
Function Plot
import com.cibo.evilplot.colors.HTMLNamedColors._
import com.cibo.evilplot.numeric.Bounds
import com.cibo.evilplot.plot._

Overlay(
  FunctionPlot.series(x => x * x, "y = x^2",
    HTMLNamedColors.dodgerBlue, xbounds = Some(Bounds(-1, 1))),
  FunctionPlot.series(x => math.pow(x, 3), "y = x^3",
    HTMLNamedColors.crimson, xbounds = Some(Bounds(-1, 1))),
  FunctionPlot.series(x => math.pow(x, 4), "y = x^4",
    HTMLNamedColors.green, xbounds = Some(Bounds(-1, 1)))
).title("A bunch of polynomials.")
  .overlayLegend()
  .standard()
  .render()
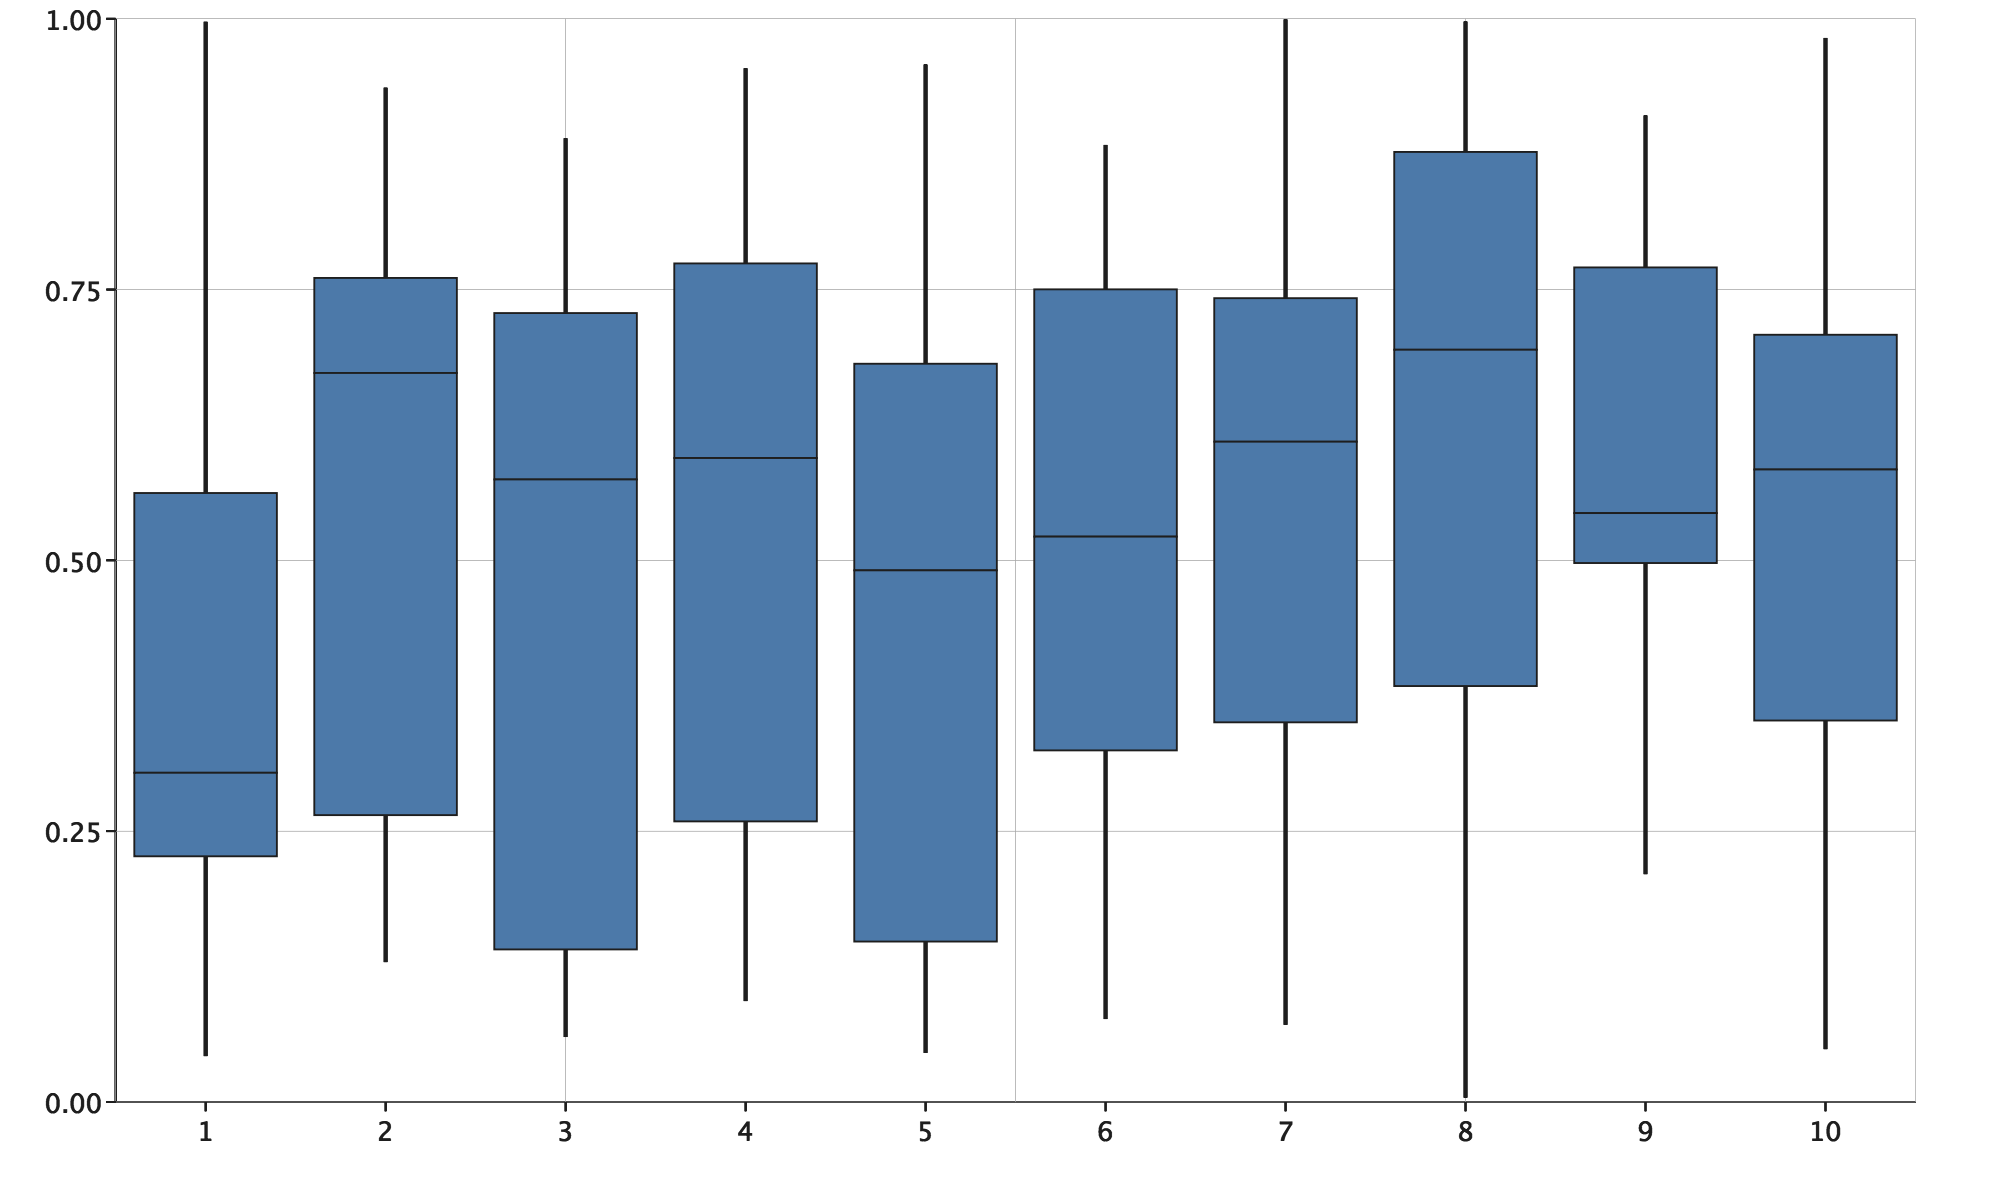
Box Plot
import com.cibo.evilplot.plot._
import scala.util.Random

val data = Seq.fill(10)(Seq.fill(Random.nextInt(30))(Random.nextDouble()))
BoxPlot(data)
  .standard(xLabels = (1 to 10).map(_.toString))
  .render()
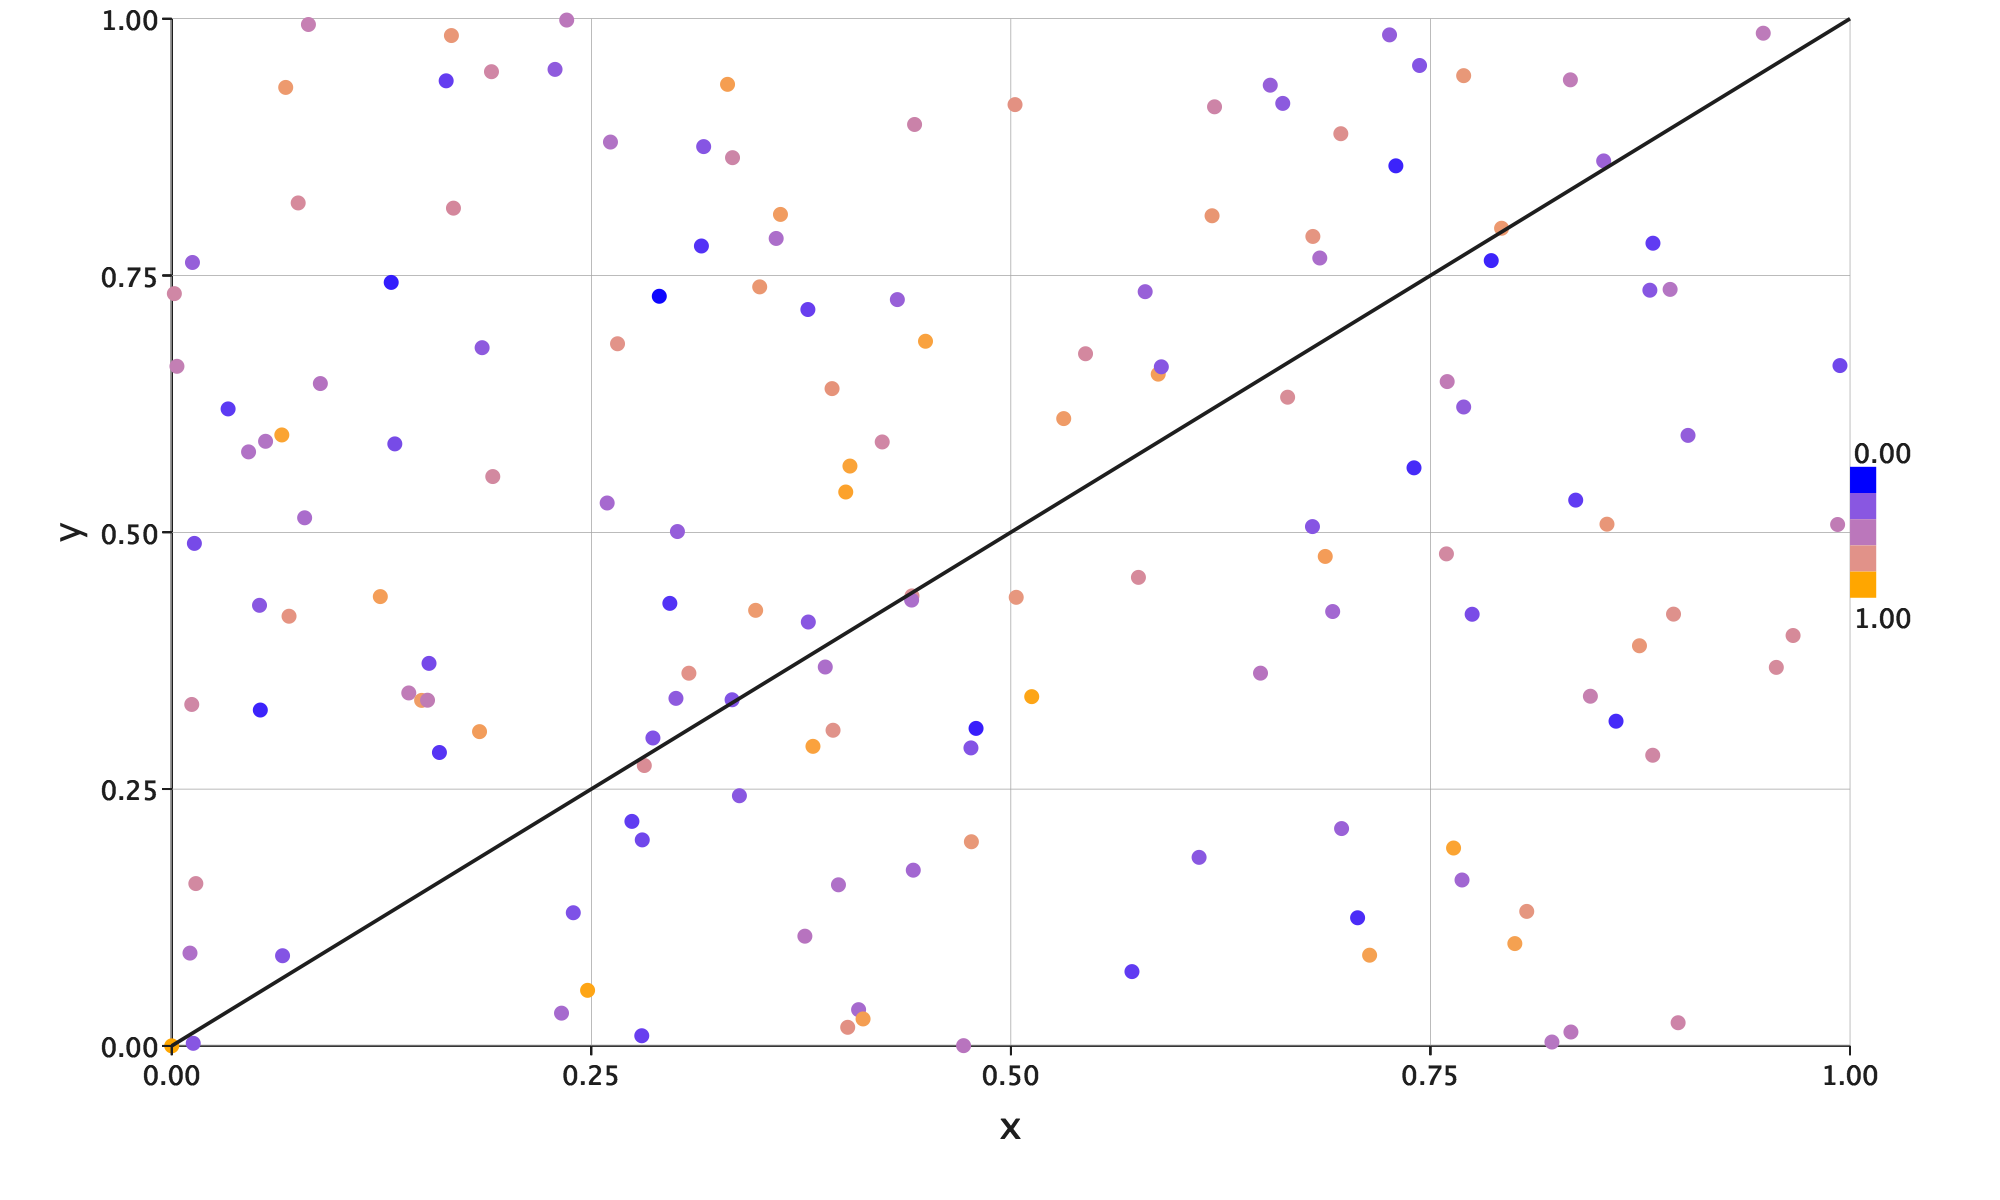
Scatter Plot
import com.cibo.evilplot.numeric._
import com.cibo.evilplot.plot._
import com.cibo.evilplot.plot.renderers.PointRenderer

val points = Seq.fill(150) {
  Point(Random.nextDouble(), Random.nextDouble())
} :+ Point(0.0, 0.0)
val years = Seq.fill(150)(Random.nextDouble()) :+ 1.0
ScatterPlot(
  points,
  pointRenderer = Some(PointRenderer.depthColor(years, None, None))
)
  .standard()
  .xLabel("x")
  .yLabel("y")
  .trend(1, 0)
  .rightLegend()
  .render()
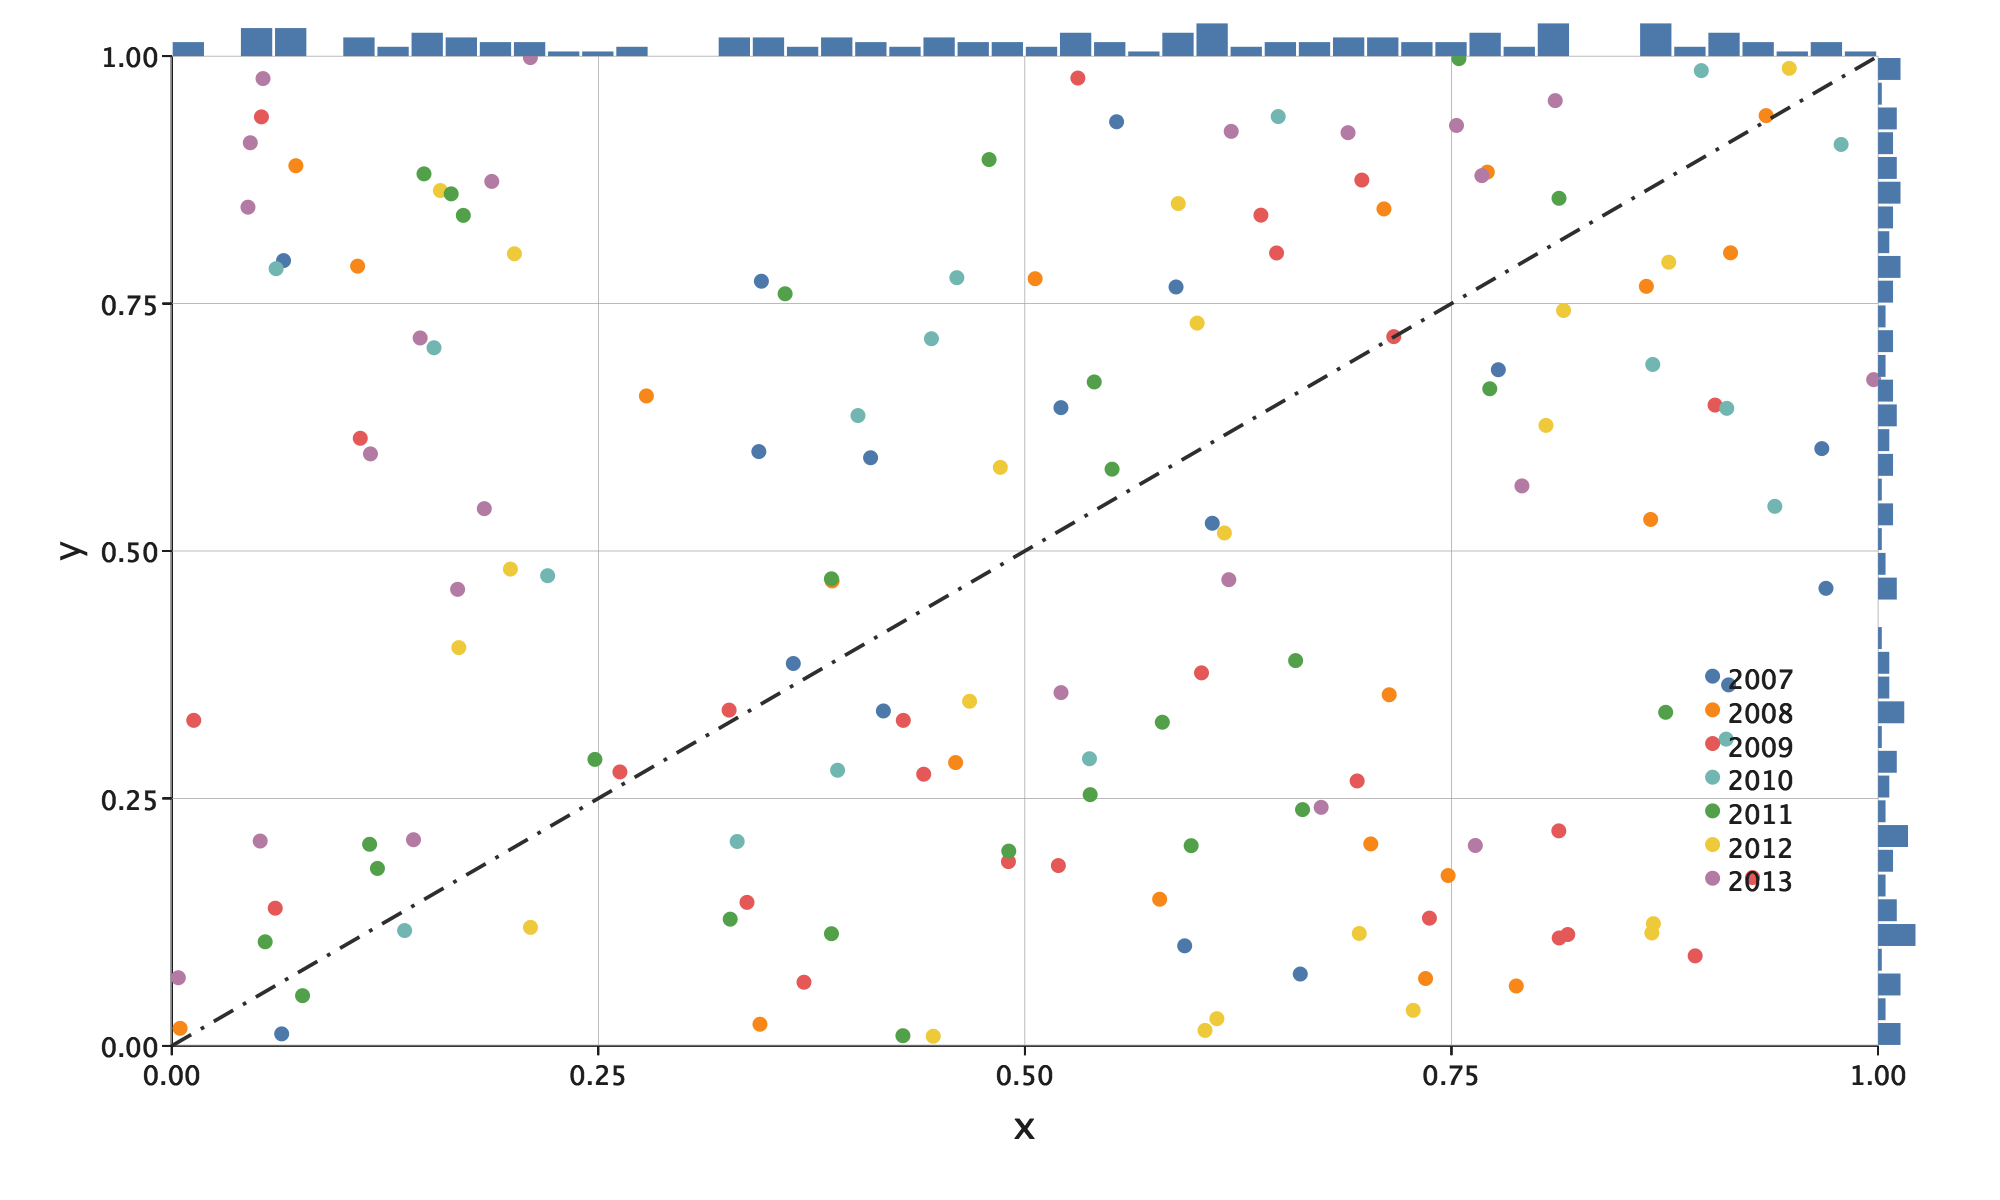
Scatter Plot with Marginal Histograms
import com.cibo.evilplot.colors.RGB
import com.cibo.evilplot.geometry.Extent
import com.cibo.evilplot.geometry.LineStyle.DashDot
import com.cibo.evilplot.numeric.Point
import com.cibo.evilplot.plot._
import com.cibo.evilplot.plot.renderers.PointRenderer

val allYears = (2007 to 2013).map(_.toDouble).toVector
val data = Seq.fill(150)(Point(Random.nextDouble(), Random.nextDouble()))
val years = Seq.fill(150)(allYears(Random.nextInt(allYears.length)))

val xhist = Histogram(data.map(_.x), bins = 50)
val yhist = Histogram(data.map(_.y), bins = 40)
ScatterPlot(
  data = data,
  pointRenderer = Some(PointRenderer.colorByCategory(years))
).topPlot(xhist)
  .rightPlot(yhist)
  .standard()
  .title("Measured vs Actual")
  .xLabel("measured")
  .yLabel("actual")
  .trend(1, 0, color = RGB(45, 45, 45), lineStyle = LineStyle.DashDot)
  .overlayLegend(x = 0.95, y = 0.8)
  .render(Extent(600, 400))
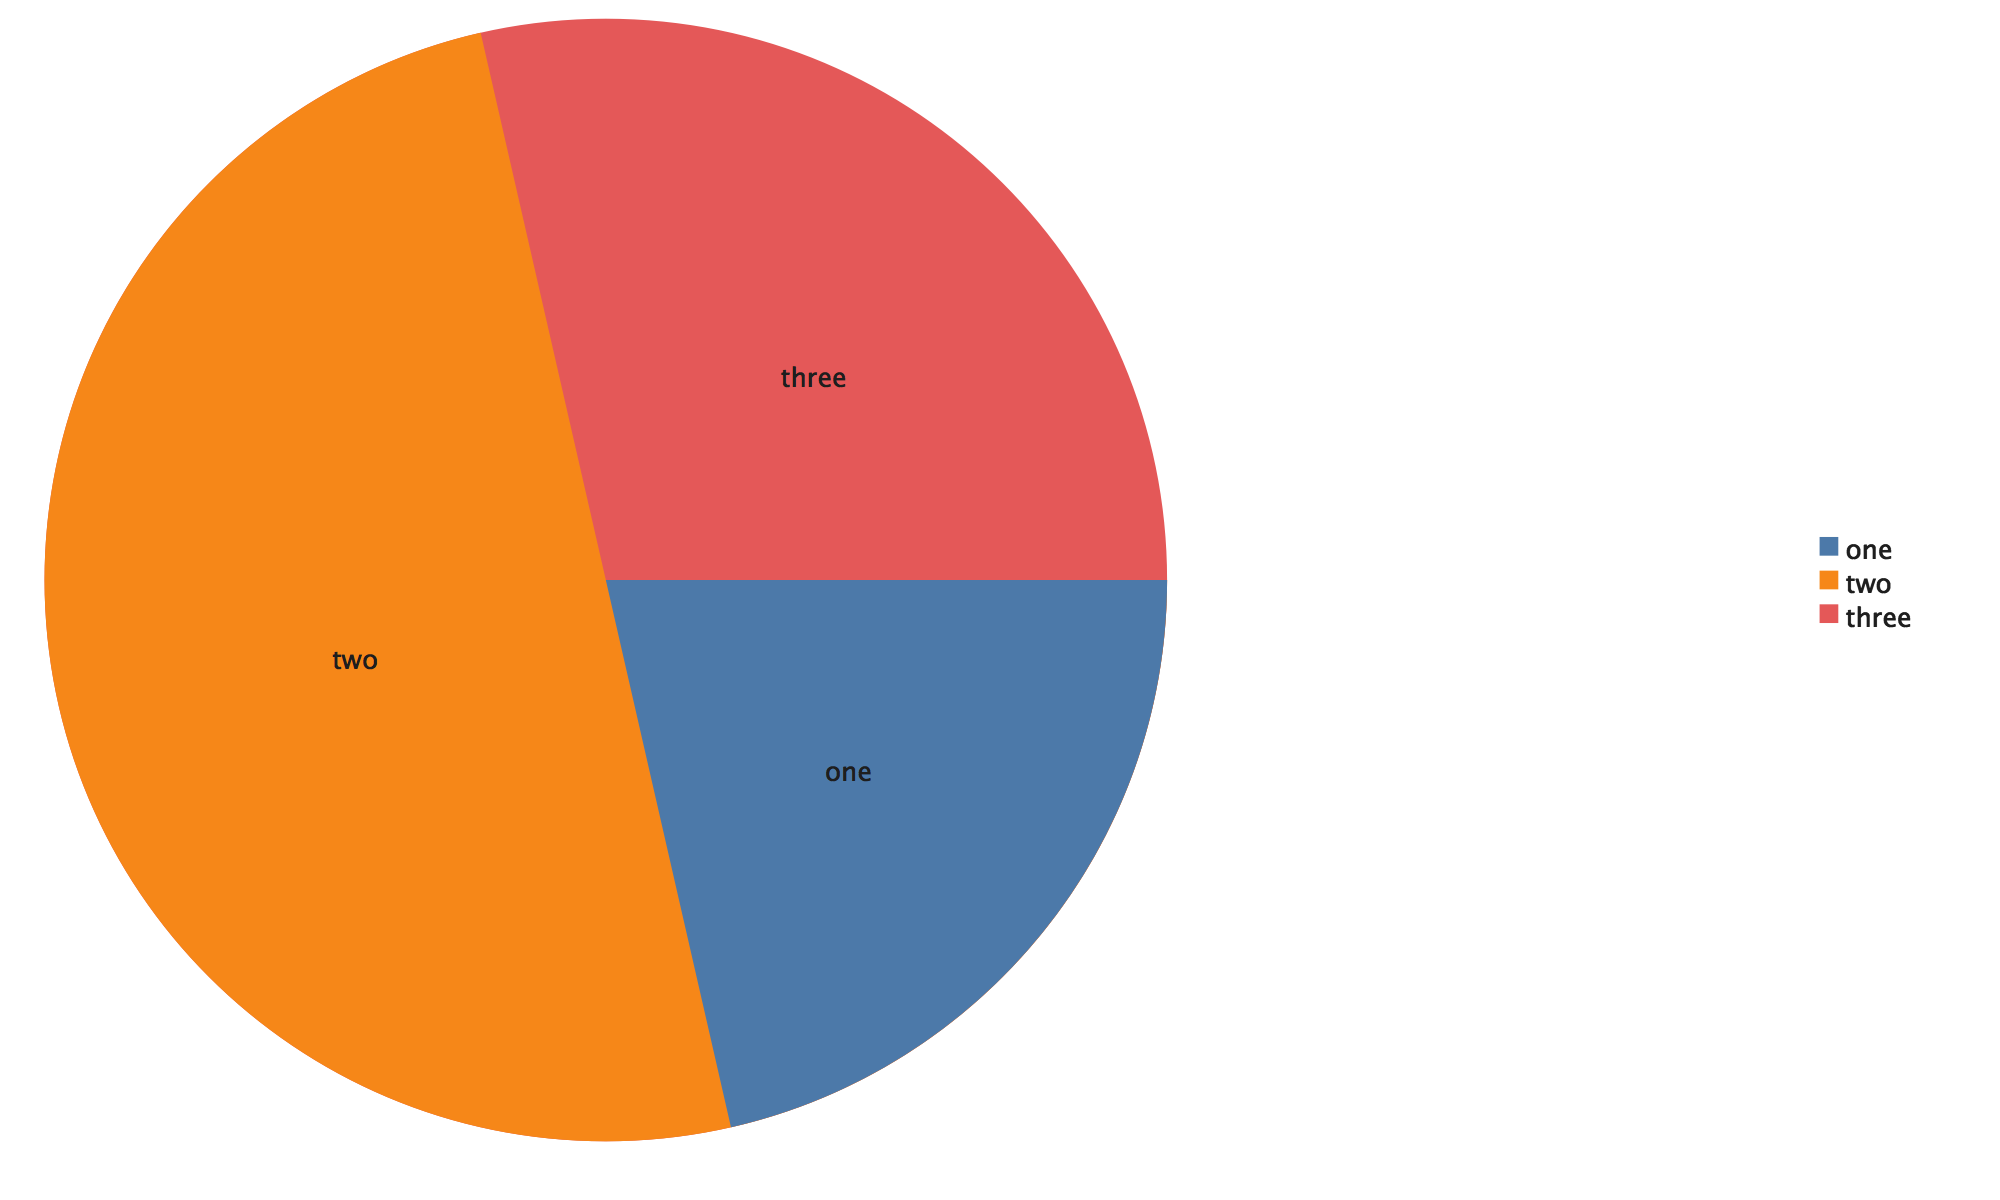
Pie Chart
import com.cibo.evilplot.plot._

val data = Seq("one" -> 1.5, "two" -> 3.5, "three" -> 2.0)
PieChart(data).rightLegend().render()
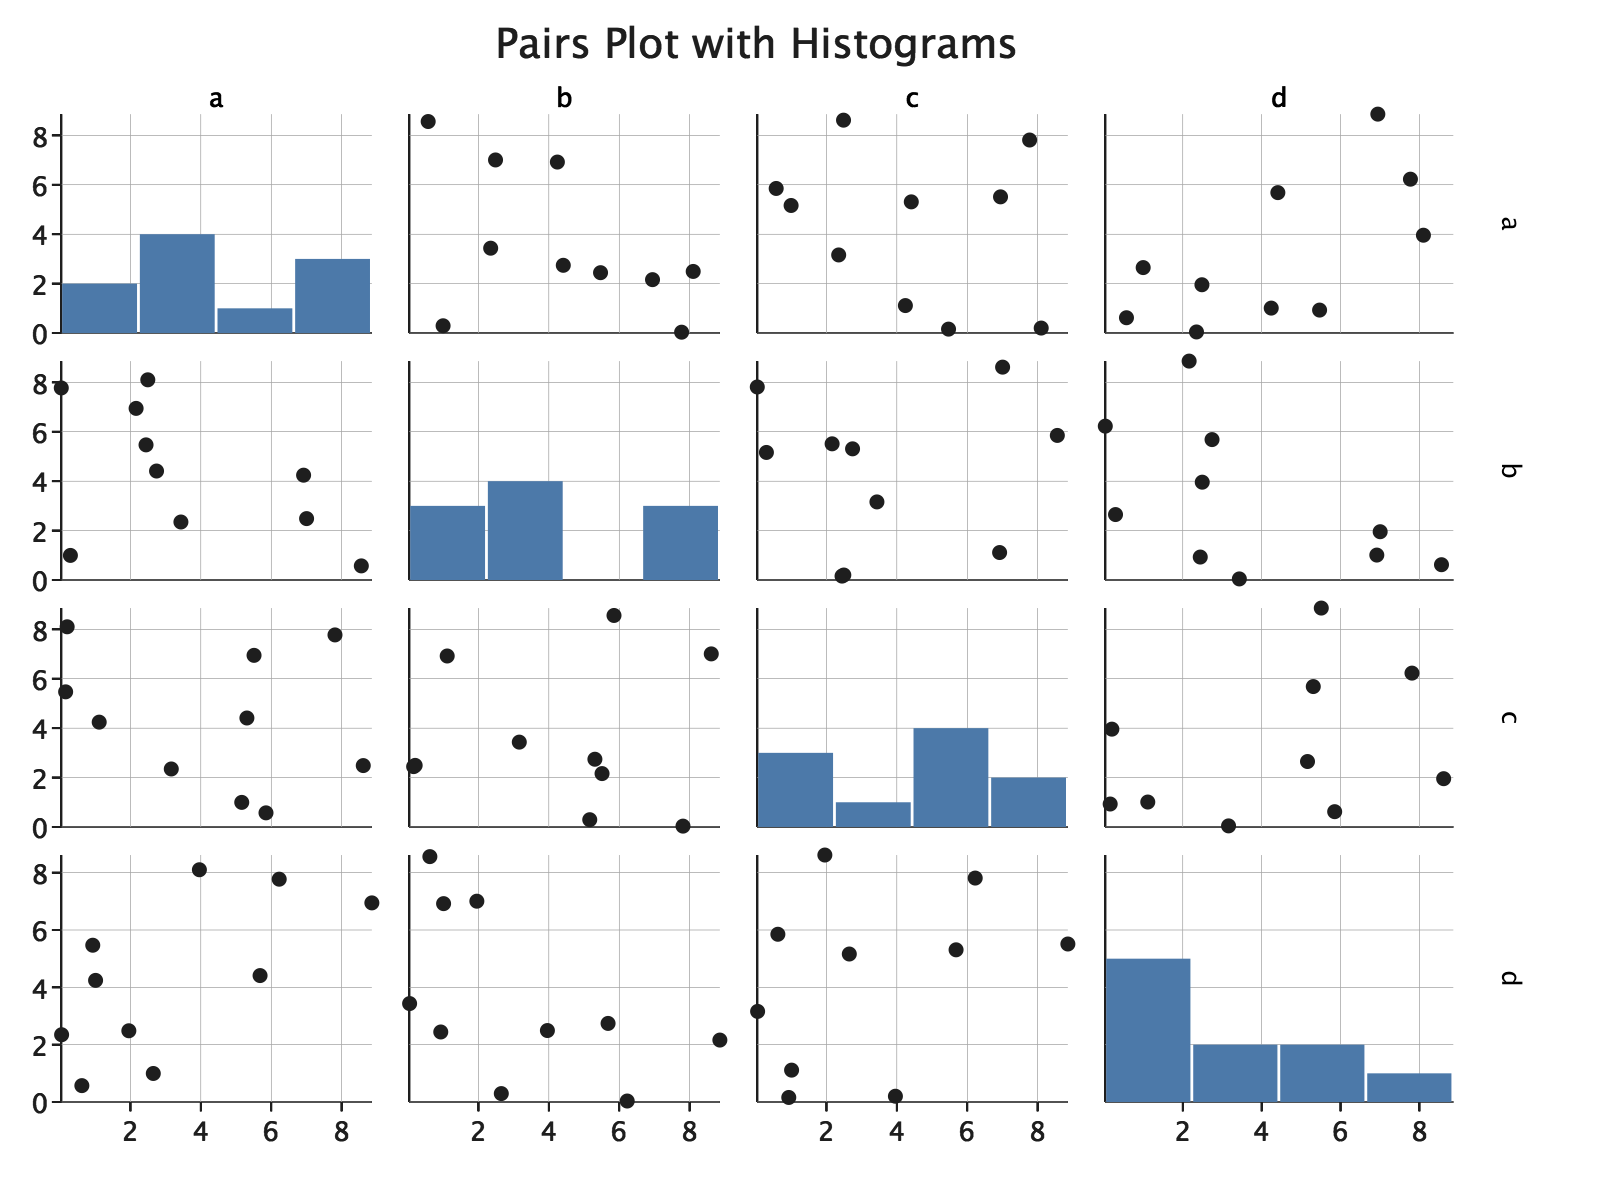
Pairs Plot
A pairs plot can be built by combining ScatterPlot and Histogram plots with Facet.
import com.cibo.evilplot.numeric.Point
import com.cibo.evilplot.plot._
import com.cibo.evilplot.plot.aesthetics.DefaultTheme._
import scala.util.Random

val labels = Vector("a", "b", "c", "d")
val data = for (i <- 1 to 4) yield {
  (labels(i - 1), Seq.fill(10) { Random.nextDouble() * 10 })
}
val plots = for ((xlabel, xdata) <- data) yield {
  for ((ylabel, ydata) <- data) yield {
    val points = (xdata, ydata).zipped.map { (a, b) => Point(a, b) }
    if (ylabel == xlabel) {
      Histogram(xdata, bins = 4)
    } else {
      ScatterPlot(points)
    }
  }
}
Facets(plots)
  .standard()
  .title("Pairs Plot with Histograms")
  .topLabels(data.map { _._1 })
  .rightLabels(data.map { _._1 })
  .render()
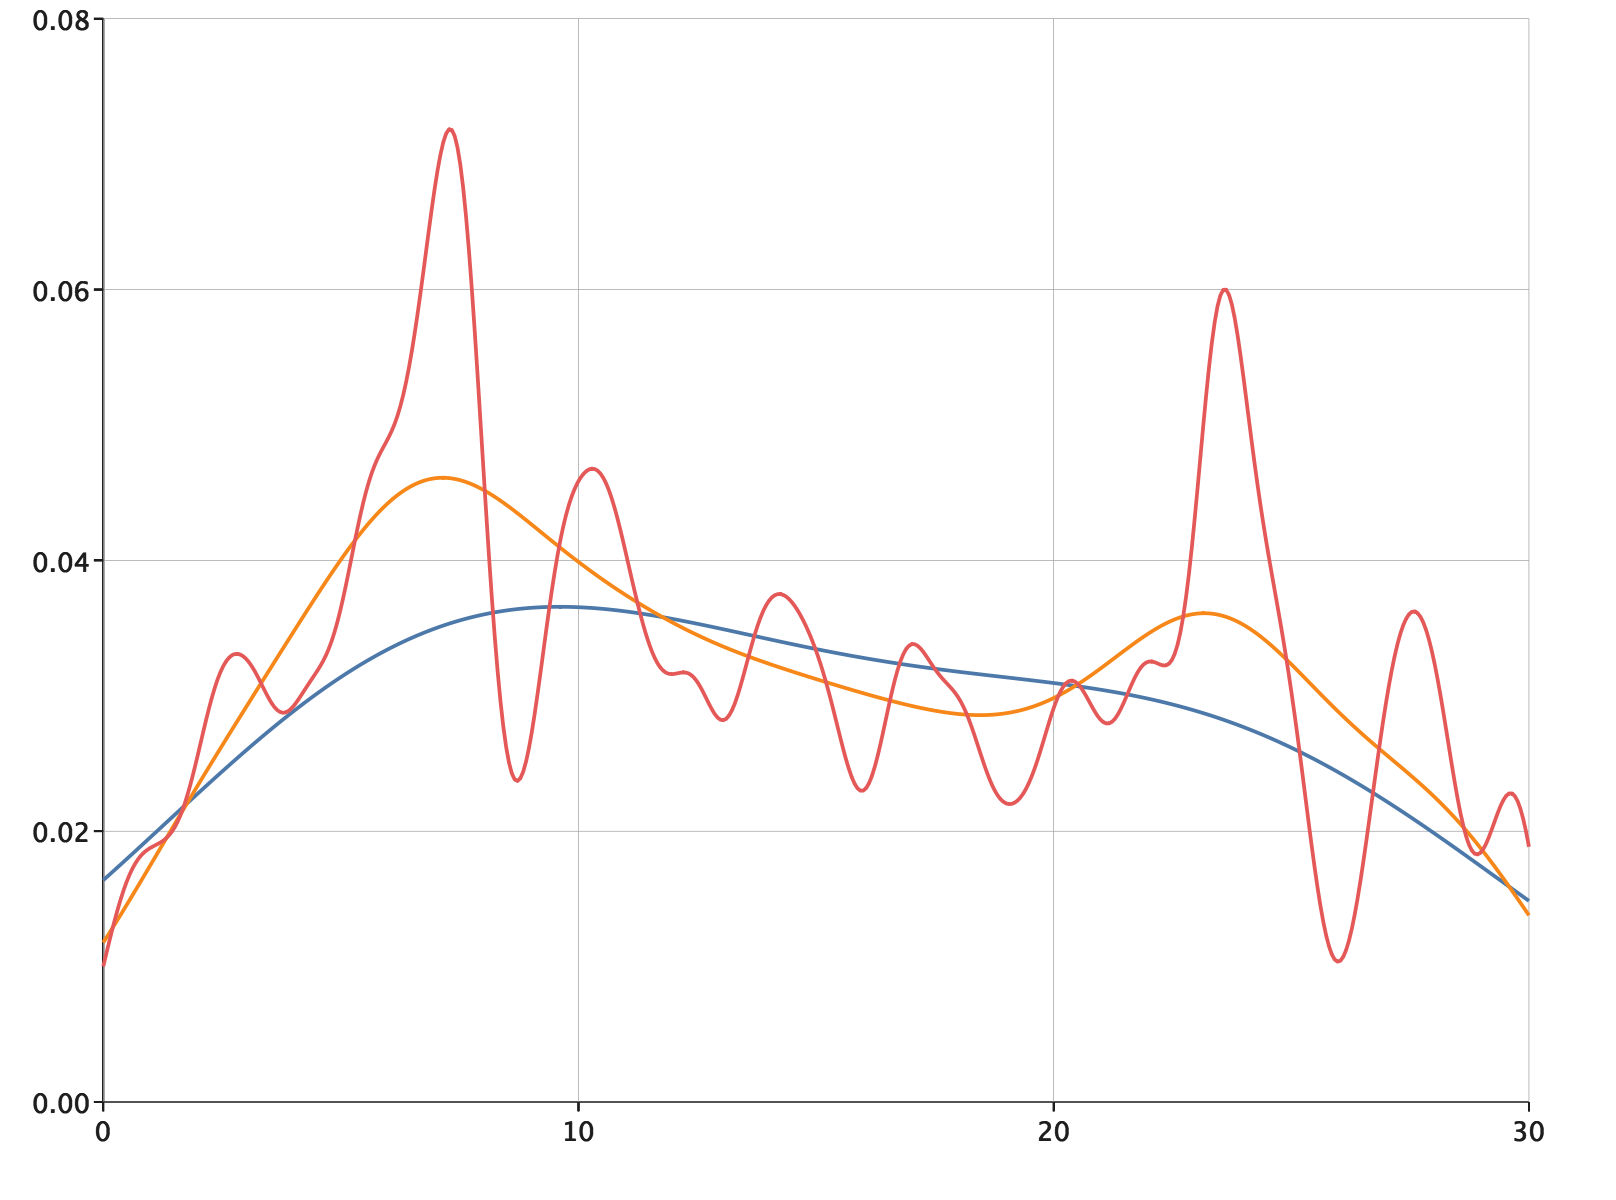
Density Plot
A FunctionPlot can be used to build density plots.
import com.cibo.evilplot.colors.Color
import com.cibo.evilplot.numeric.Bounds
import com.cibo.evilplot.plot._
import com.cibo.evilplot.plot.aesthetics.DefaultTheme._
import com.cibo.evilplot.plot.renderers.PathRenderer
import scala.util.Random

def gaussianKernel(u: Double): Double = {
  1 / math.sqrt(2 * math.Pi) * math.exp(-0.5d * u * u)
}

def densityEstimate(data: Seq[Double], bandwidth: Double)(
  x: Double
): Double = {
  val totalProbDensity = data.map { x_i =>
    gaussianKernel((x - x_i) / bandwidth)
  }.sum
  totalProbDensity / (data.length * bandwidth)
}

val data = Seq.fill(150)(Random.nextDouble() * 30)
val colors = Color.getGradientSeq(3)
val bandwidths = Seq(5d, 2d, 0.5d)
Overlay(
  colors.zip(bandwidths).map { case (c, b) =>
    FunctionPlot(
      densityEstimate(data, b),
      Some(Bounds(0, 30)),
      Some(500),
      Some(PathRenderer.default(color = Some(c)))
    )
  }:_*
)
  .standard()
  .xbounds(0, 30)
  .render()
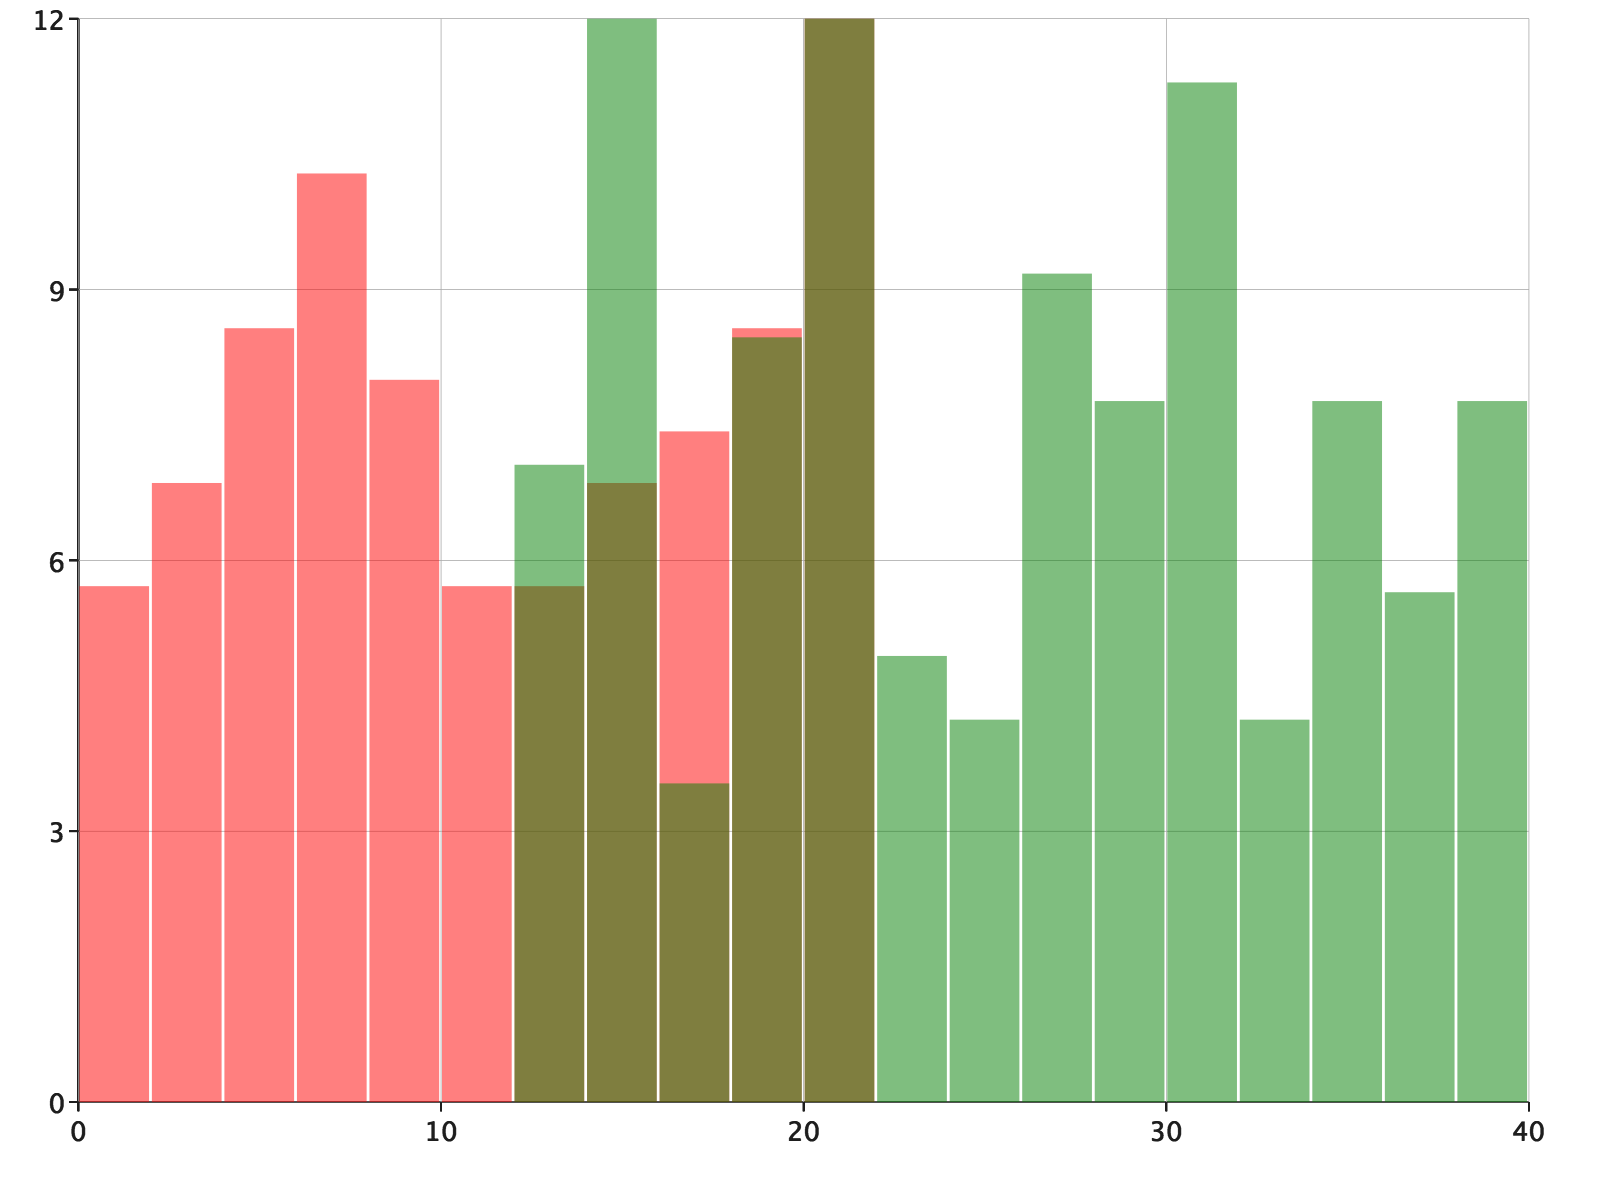
Overlapping Histograms
import com.cibo.evilplot.colors.HTMLNamedColors.{green, red}
import com.cibo.evilplot.geometry.Extent
import com.cibo.evilplot.plot._
import com.cibo.evilplot.plot.aesthetics.DefaultTheme._
import com.cibo.evilplot.plot.renderers.BarRenderer
import scala.util.Random

val plotAreaSize: Extent = Extent(1000, 600)
val data = Seq.fill(150)(Random.nextDouble() * 22)
val data2 = Seq.fill(150)((Random.nextDouble() * 28) + 12)
Overlay(
  Histogram(data,
   barRenderer = Some(BarRenderer.default(Some(red.copy(opacity = 0.5))))),
  Histogram(data2,
   barRenderer = Some(BarRenderer.default(Some(green.copy(opacity = 0.5)))))
)
  .standard()
  .render(plotAreaSize)
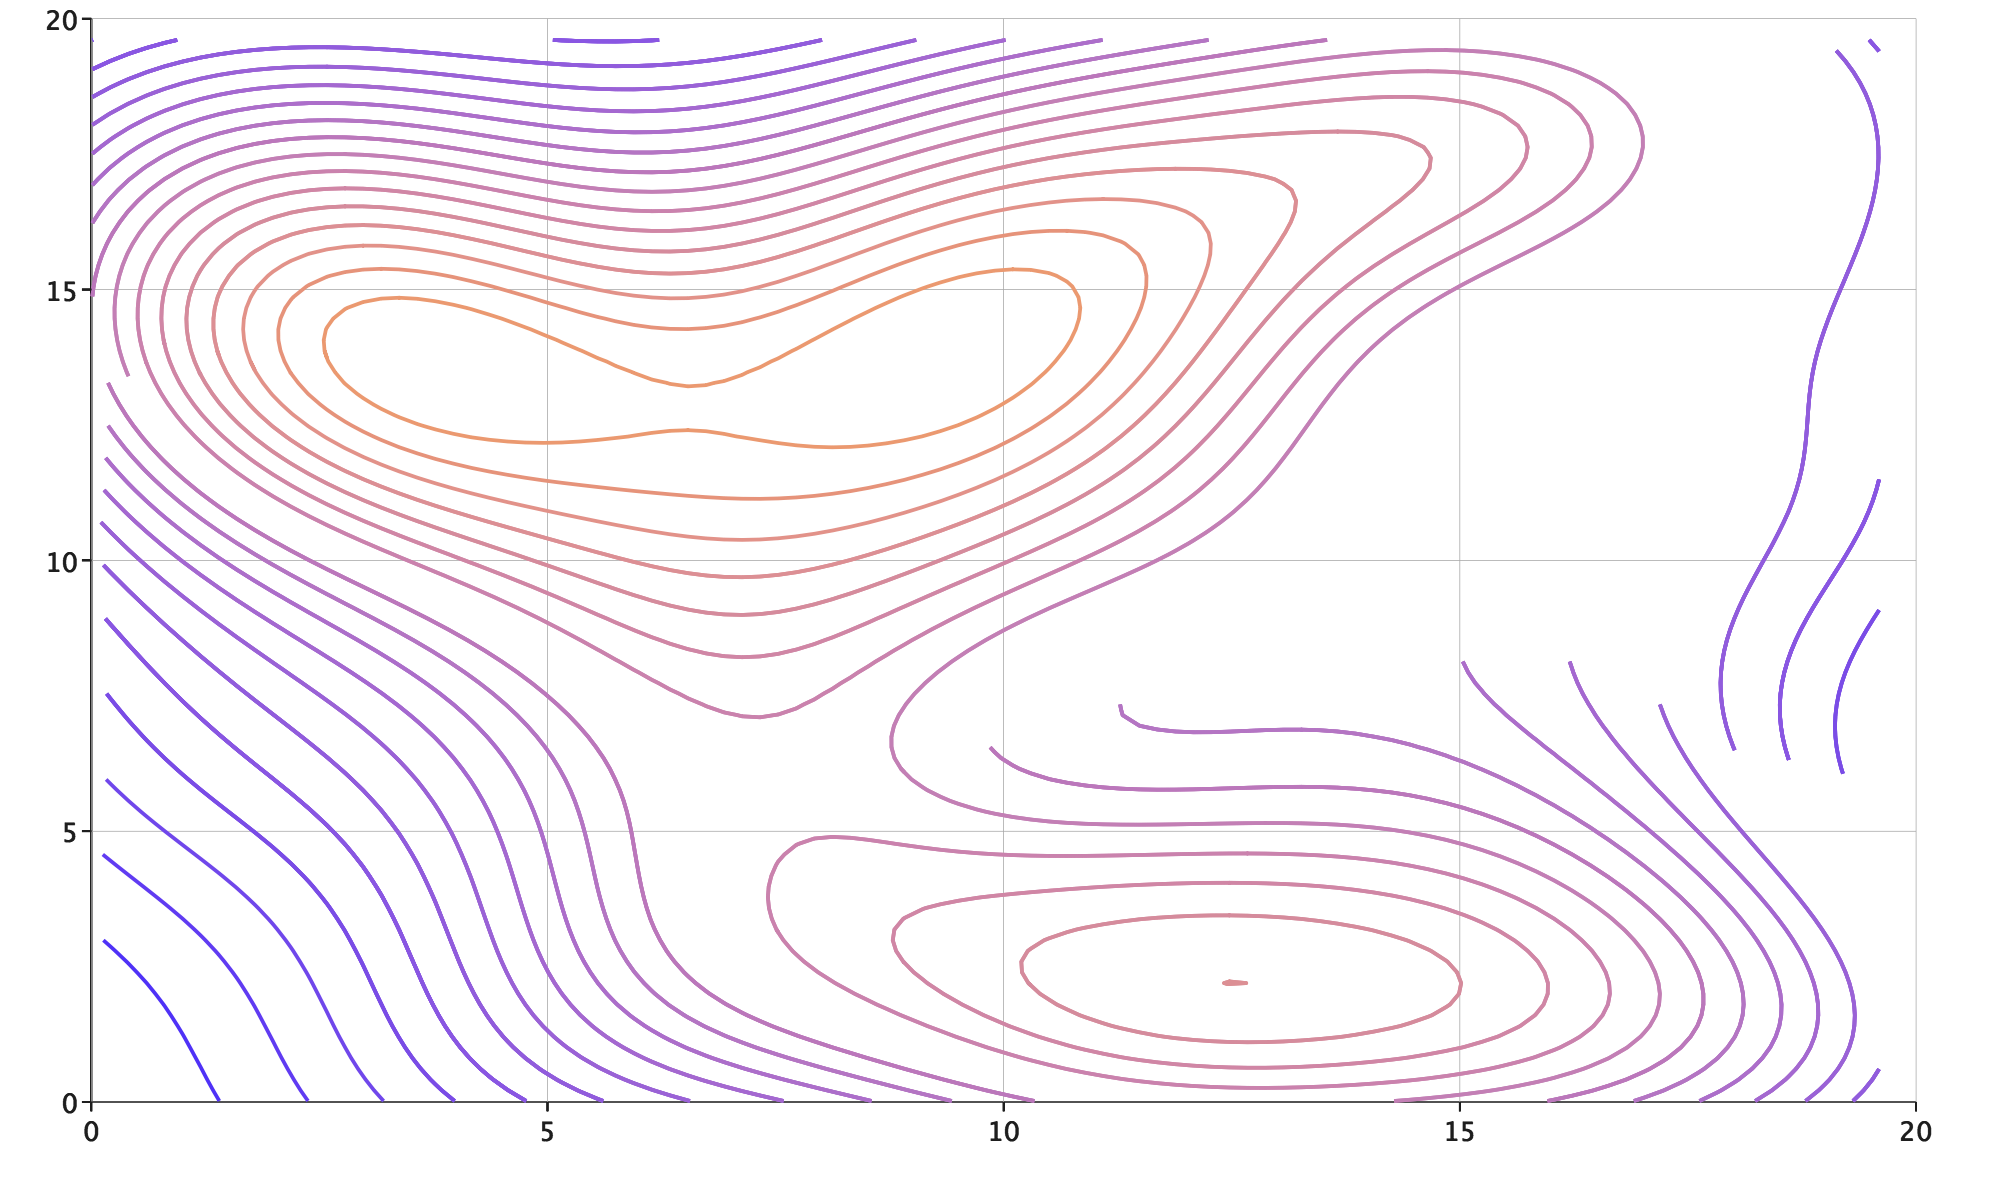
Contour Plot
import com.cibo.evilplot.numeric.Point
import com.cibo.evilplot.plot._
import com.cibo.evilplot.plot.aesthetics.DefaultTheme._
import scala.util.Random

val data = Seq.fill(100) {
  Point(Random.nextDouble() * 20, Random.nextDouble() * 20
}
ContourPlot(data)
  .standard()
  .xbounds(0, 20)
  .ybounds(0, 20)
  .render()