Colors
Colors in EvilPlot are described by their HSL representation.
import com.cibo.evilplot.colors._

val transparentColor = HSLA(210, 100, 56, 0.8)
val color = HSL(210, 100, 56) // fully opaque

You can also use the RGB representation to describe a color. It will be converted to HSL automatically.
import com.cibo.evilplot.colors._

val transparentColor = RGBA(230, 126, 34, 0.8)
val color = RGB(230, 126, 34)
val hexColor = HEX("E67E22")

Predefined colors
All of the HTML named colors are available to use:
import com.cibo.evilplot.colors._

val htmlRed = HTMLNamedColors.red
val htmlDodgerBlue = HTMLNamedColors.dodgerBlue
val htmlTomato = HTMLNamedColors.tomato

Modifying colors
You can create colors by modifying the HSLA properties of another color.
import com.cibo.evilplot.colors._

val htmlRed = HTMLNamedColors.red
val transparentRed = htmlRed.copy(opacity = 0.5)
val difficultWhite = htmlRed.copy(lightness = 100)

EvilPlot has several helpful methods for modifying colors:
import com.cibo.evilplot.colors._

val htmlRed = HTMLNamedColors.red

val lighterRed = htmlRed.lighten(20) // Increase lightness by 20
val darkerRed = htmlRed.darken(20)

// Two new colors evenly spaced around the HSL color wheel from the first
val (triad1, triad2) = htmlRed.triadic

// Two new colors adjacent to the first color on the color wheel
// (+/- 45 degrees away in this example)
val (analogue1, analogue2) = htmlRed.analogous(45)

Color Sequences and Gradients
A variety of streams and sequences of colors can be generated.
import com.cibo.evilplot.colors._

val colors = Color.stream.take(40)

import com.cibo.evilplot.colors._
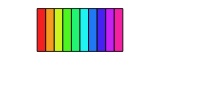
// A gradient across all hues
val colors = Color.getGradientSeq(10)
import com.cibo.evilplot.colors._
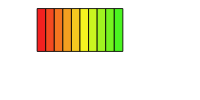
// A gradient between specific hues
val colors = Color.getGradientSeq(10, startHue = 0, endHue = 120)
import com.cibo.evilplot.colors._

val colors = Color.getDefaultPaletteSeq(8)

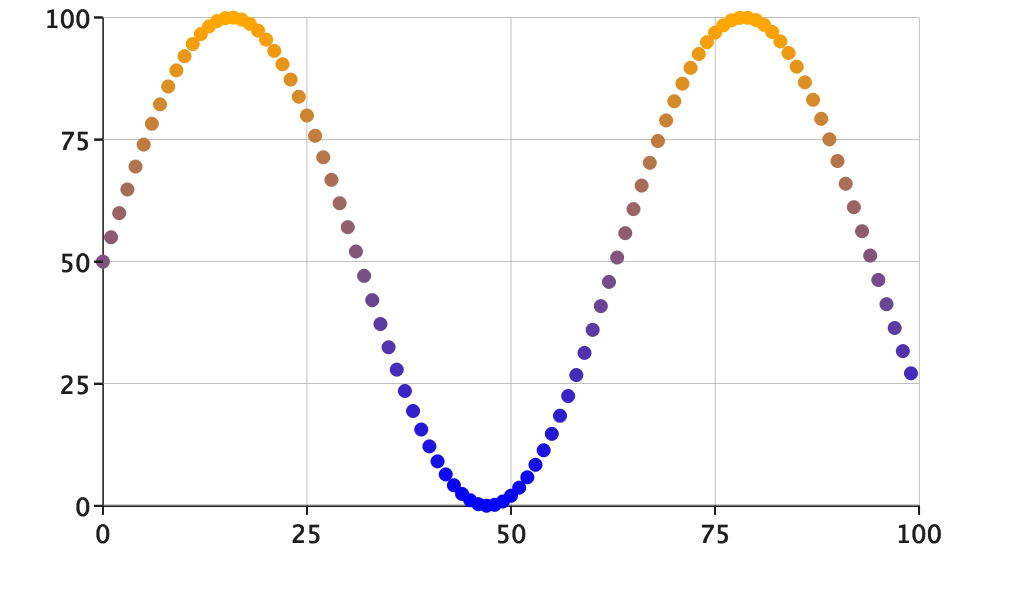
Data can be colored using a continuous gradient.
import com.cibo.evilplot.colors._
import com.cibo.evilplot.plot._
import com.cibo.evilplot.plot.renderers.PointRenderer
import com.cibo.evilplot.geometry.Extent
import com.cibo.evilplot.numeric.Point

val gradient = ContinuousColoring.gradient(HTMLNamedColors.blue, HTMLNamedColors.orange)

val points = Seq.tabulate(100) { i =>
  Point(i.toDouble, (math.sin(i.toDouble / 10) * 50) + 50)
}
val renderer = PointRenderer.depthColor(points.map(_.y), Some(gradient))
ScatterPlot(points, pointRenderer = Some(renderer))
  .frame().xAxis().yAxis().xGrid().yGrid()
  .xbounds(0, 100).ybounds(0, 100)
  .render(Extent(500, 300))
import com.cibo.evilplot.colors._

// Multiple stop points can be given for continuous gradients
val gradient = ContinuousColoring.gradient(Seq(
  HTMLNamedColors.green,
  HTMLNamedColors.red,
  HTMLNamedColors.blue,
  HTMLNamedColors.red
), Some(0d), Some(40d), GradientMode.Linear)

val gradientFunc = gradient(Seq(0, 40))
val colors = Seq.tabulate(40) { gradientFunc(_) }

Categorical data can be colored using a categorical gradient.
import com.cibo.evilplot.colors._
import com.cibo.evilplot.plot._
import com.cibo.evilplot.plot.renderers.PointRenderer
import com.cibo.evilplot.geometry.Extent
import com.cibo.evilplot.numeric.Point

val gradient: Coloring[Double] = CategoricalColoring.gradient(
  HTMLNamedColors.blue,
  HTMLNamedColors.orange
)

val points = Seq.tabulate(100) { i => Point(i.toDouble, i.toDouble) }
val renderer = PointRenderer.colorByCategory(points.map(p => p.x % 3), Some(gradient))
ScatterPlot(points, pointRenderer = Some(renderer))
  .frame().xAxis().yAxis().xGrid().yGrid()
  .xbounds(0, 100).ybounds(0, 100)
  .rightLegend()
  .render(Extent(500, 300))
