Custom Renderers
In the introduction to plotting with EvilPlot, we gave ScatterPlot PointRenderer.colorByCategory as an argument. We
also mentioned that there are several PointRenderers available by default. If you took a look at the plot catalog, you
might have also seen that there were some other types of renderers, like BoxRenderer, PathRenderer, and
BarRenderer that we can use to customize the base plots.
All of these are PlotElementRenderers, and you’re not limited to the ones that EvilPlot provides. With a little bit of
understanding of the Drawing API, implementing a renderer can be the easiest way to get a highly
custom plot. Let’s look at the interface:
trait PlotElementRenderer[C] {
  def render(plot: Plot, extent: Extent, context: C): Drawable
}
All you have to do is define how a piece of data gets displayed as a Drawable, and you’re done. When you call
render() on the Plot later on, it will call render on your PlotElementRenderer and pass through the appropriate
context. The question is: what are those three arguments, and what can you do with them?
-
The first one is straightforward, you’ve seen
Plotall over the place already! When you define yourrendermethod, you get a hook back into the plot, so you can get certain information out of it. For example, you might be interested in applying the plot’sxtransformorytransformto some auxiliary data, and you can just pull that out:val xTransform: Double => Double = plot.xtransformer(plot, ...) -
The data to screen transformation will be different depending on how big we want to make the plot when we render it. That’s why
renderalso gets anextentargument. This is the real size of the plot once it’s rendered. Keep in mind that we’re able to access that quantity here because renderers are only called when we turn thePlotinto aDrawable, not when we construct thePlot.val xTransform: Double => Double = plot.ytransformer(plot, extent) -
Finally, the context. The context is a value of type
C. The best way to explain this parameter is probably to look at the renderers you’ve already seen, and what their respective context type is:PointRendereris aPlotElementRenderer[Int]PathRendereris aPlotElementRenderer[Seq[Point]]BoxRendereris aPlotElementRenderer[BoxPlotSummaryStatistics]
PointRenderer uses its context as a way to index into another sequence of data (like a sequence of categories in the
colorByCategory renderer). PathRenderer gets as context all the points that are in a particular path.
Let’s implement a few custom renderers as examples:
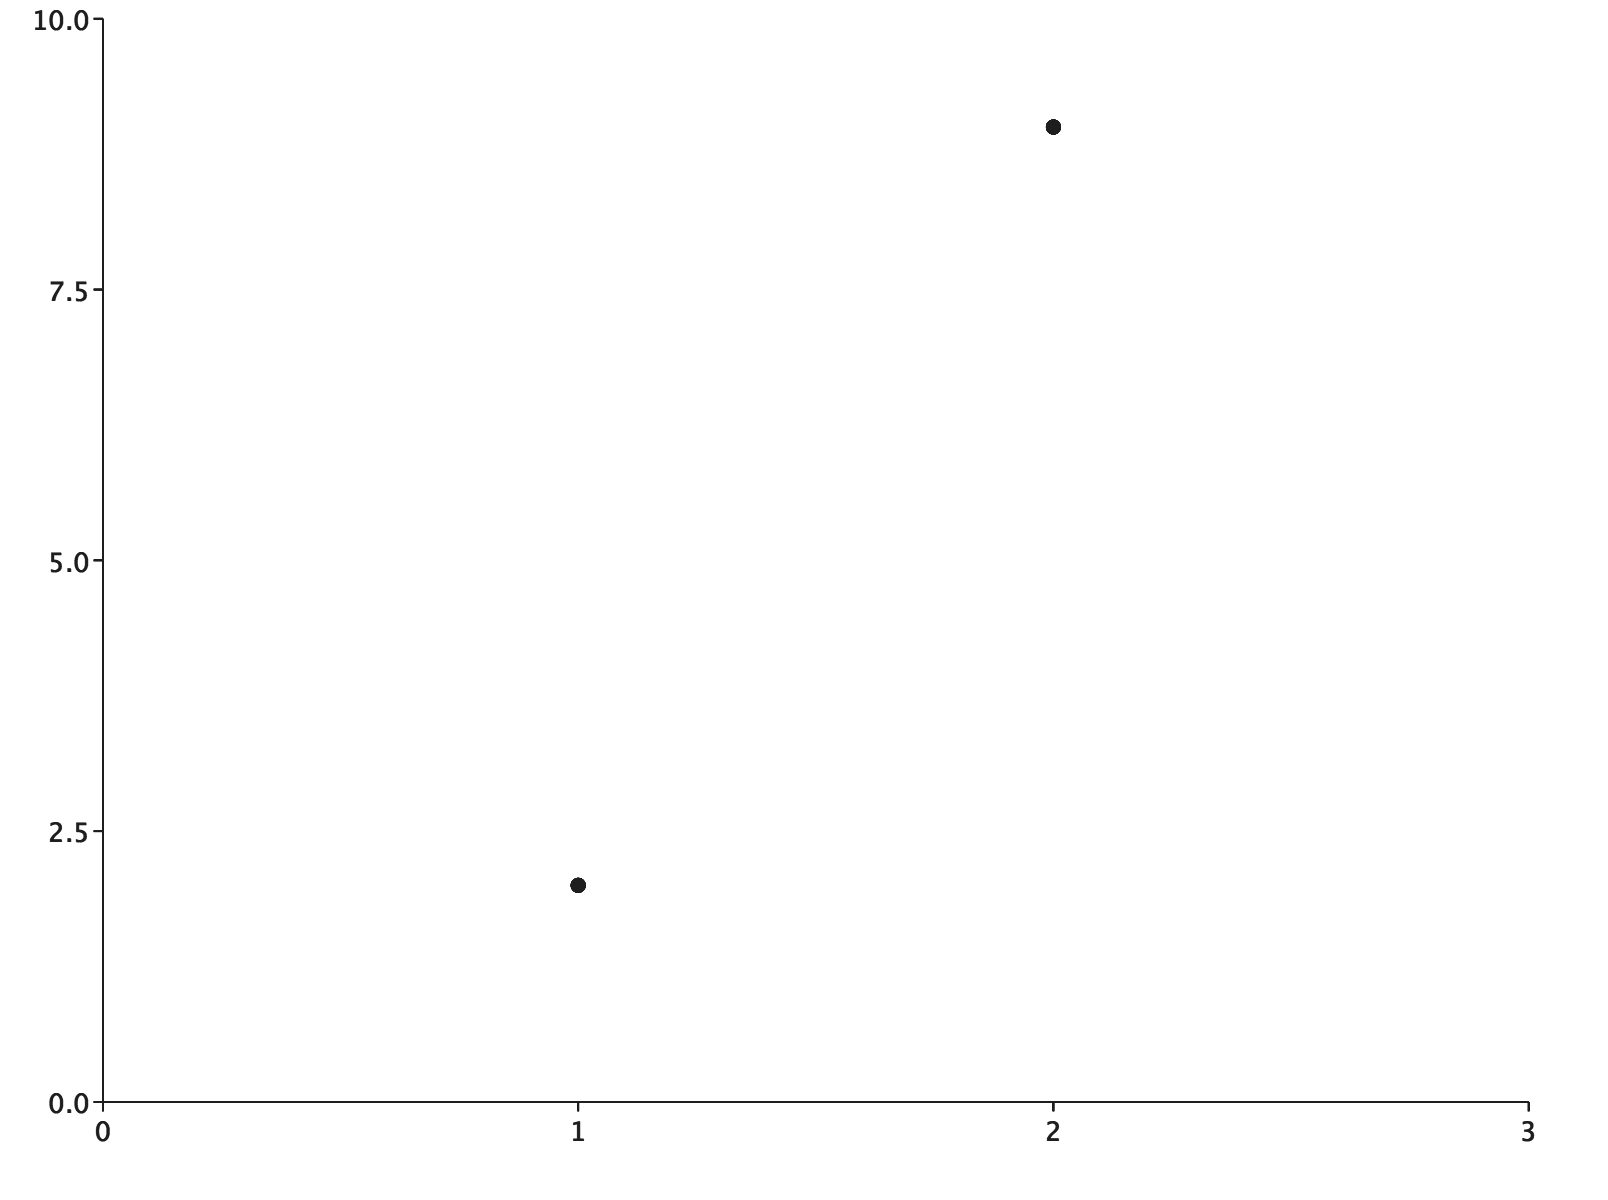
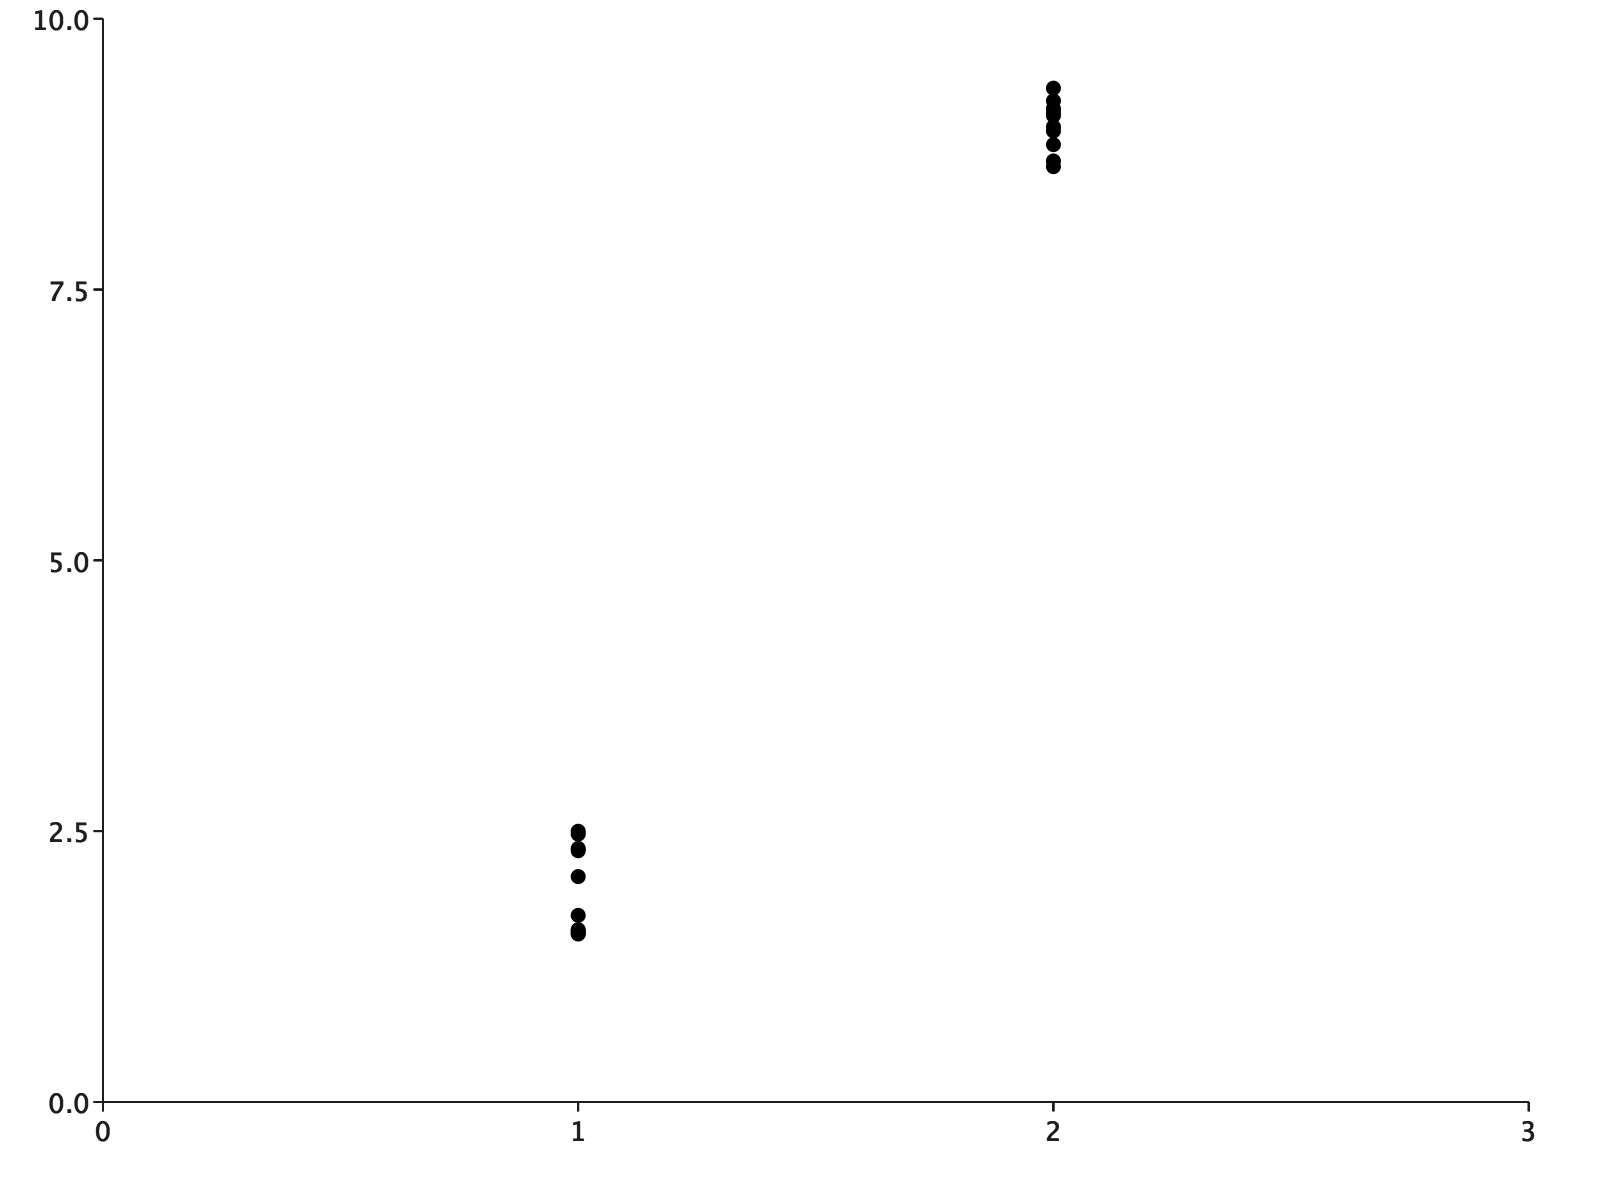
Implementing “jitter”
You might be familiar with adding random “jitter” to points in a scatter plot from other plotting libraries. We can implement that in EvilPlot as a custom point renderer. This adds a bit of jitter in the y dimension.
import com.cibo.evilplot.geometry.{Disc, Extent}
import com.cibo.evilplot.plot.Plot
import com.cibo.evilplot.plot.aesthetics.Theme
import com.cibo.evilplot.plot.renderers.PointRenderer
import scala.util.Random

def jitter(range: Double)(implicit theme: Theme): PointRenderer = (plot: Plot, extent: Extent, context: Int) => {
    val scaleY = (y: Double) =>
      plot.ytransform(plot, extent)(y + plot.ybounds.min) - extent.height
    Disc
      .centered(theme.elements.pointSize)
      .transY(scaleY(range * (Random.nextDouble() - .5)))
}
A plot using the default PointRenderer at left and the jitter renderer at right:
Coloring data using a function
Our jitter renderer didn’t access the context during plot creation at all, which makes it somewhat uninteresting and
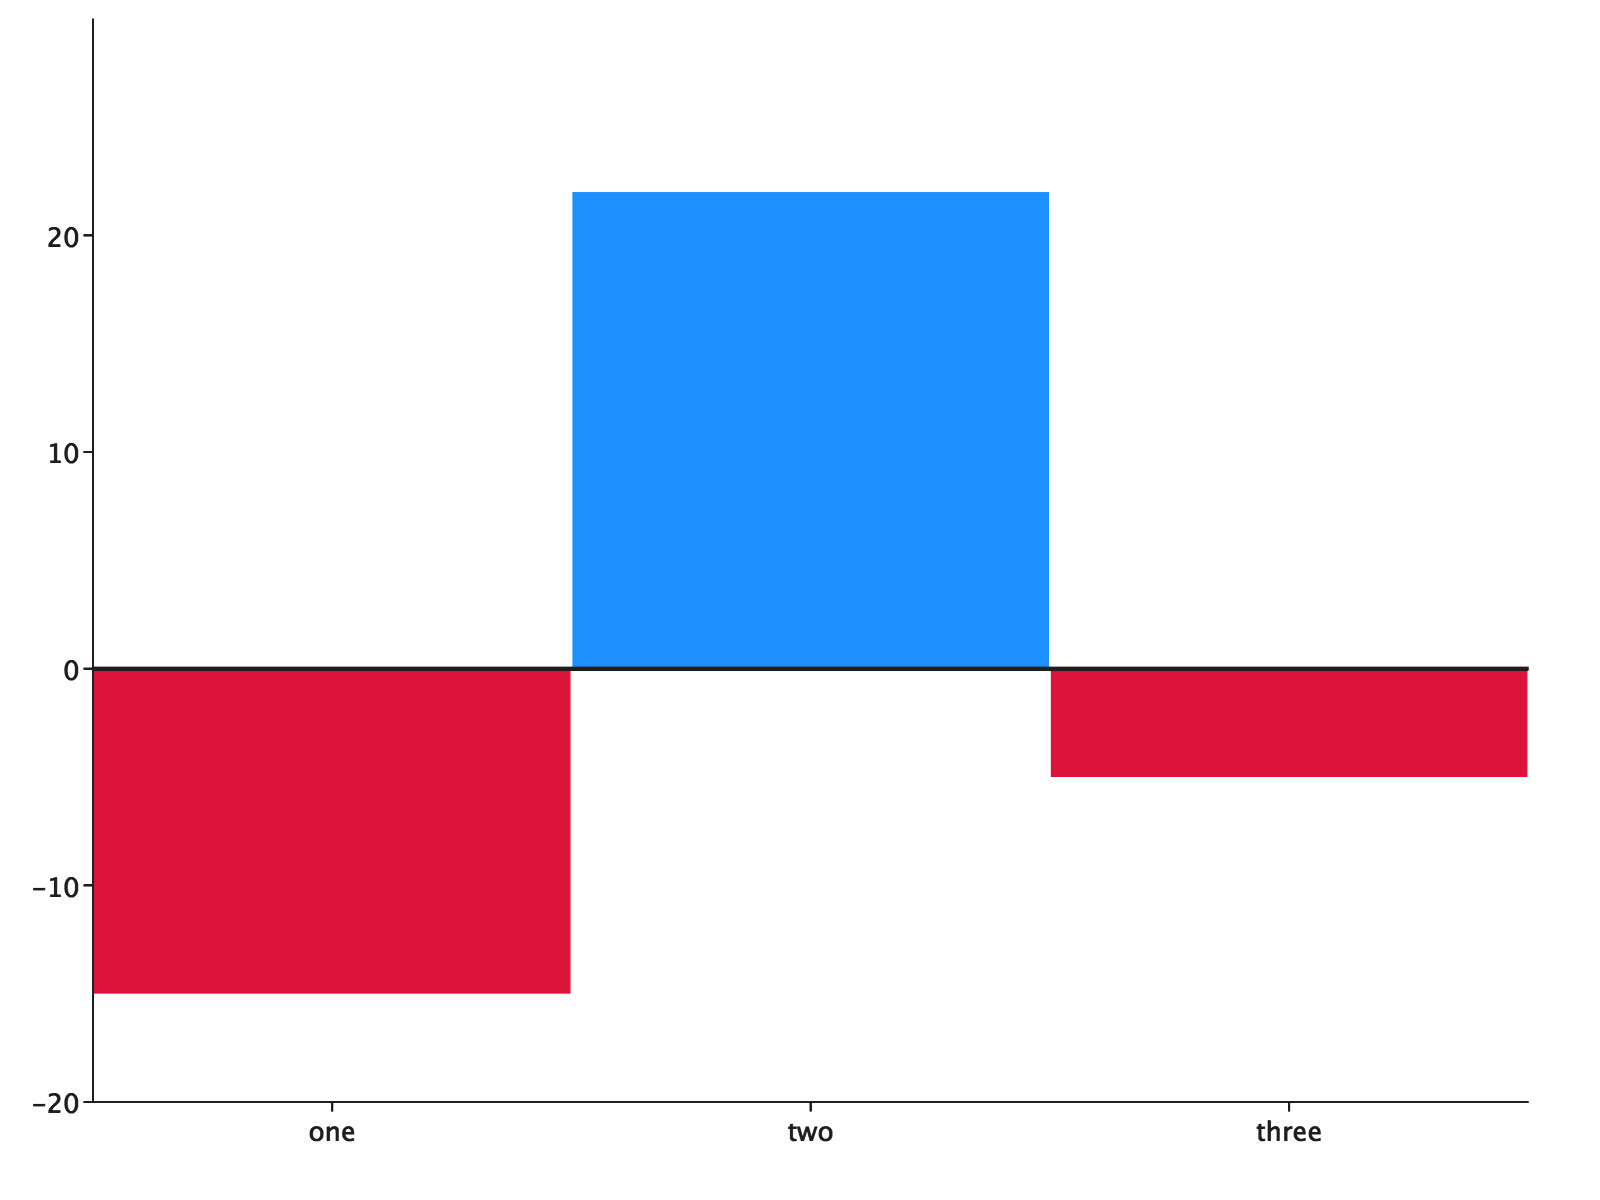
not illustrative of the power of what you can do with plot element renderers. Let’s write one that does. Imagine you
need a renderer for a bar chart that colors the bar based on the value, say red for negative and blue for positive. This
will work for non-stacked bar charts:
import com.cibo.evilplot.colors.Color
import com.cibo.evilplot.geometry.{Drawable, Extent, Rect}
import com.cibo.evilplot.plot.{Bar, Plot}
import com.cibo.evilplot.plot.renderers.BarRenderer

def colorBy(fn: Double => Color): BarRenderer = new BarRenderer {
  def render(plot: Plot, extent: Extent, category: Bar): Drawable =
    Rect(extent) filled fn(category.values.head)
}
For a stacked bar chart, things might get a bit more complicated. But, we can use this and observe it in action.
import com.cibo.evilplot.colors.Color
import com.cibo.evilplot.plot._

val coloring: Double => Color = (d: Double) =>
  if (d <= 0) crimson else dodgerBlue
BarChart.custom(Seq(-15, 22, -5).map(Bar(_)), Some(colorBy(coloring)))
  .xAxis(Seq("one", "two", "three"))
  .yAxis()
  .hline(0)
  .frame()
  .render()