Custom Components
Many of the plots in the documentation apply fluent methods to a plot before rendering, for example:
import com.cibo.evilplot.plot._
import com.cibo.evilplot.numeric.Point

LinePlot(Seq(Point(1, 1), Point(3, 3)))
  .xAxis().yAxis()
  .xGrid().yGrid()
  .hline(2d)
  .title("An example plot")
  .render()
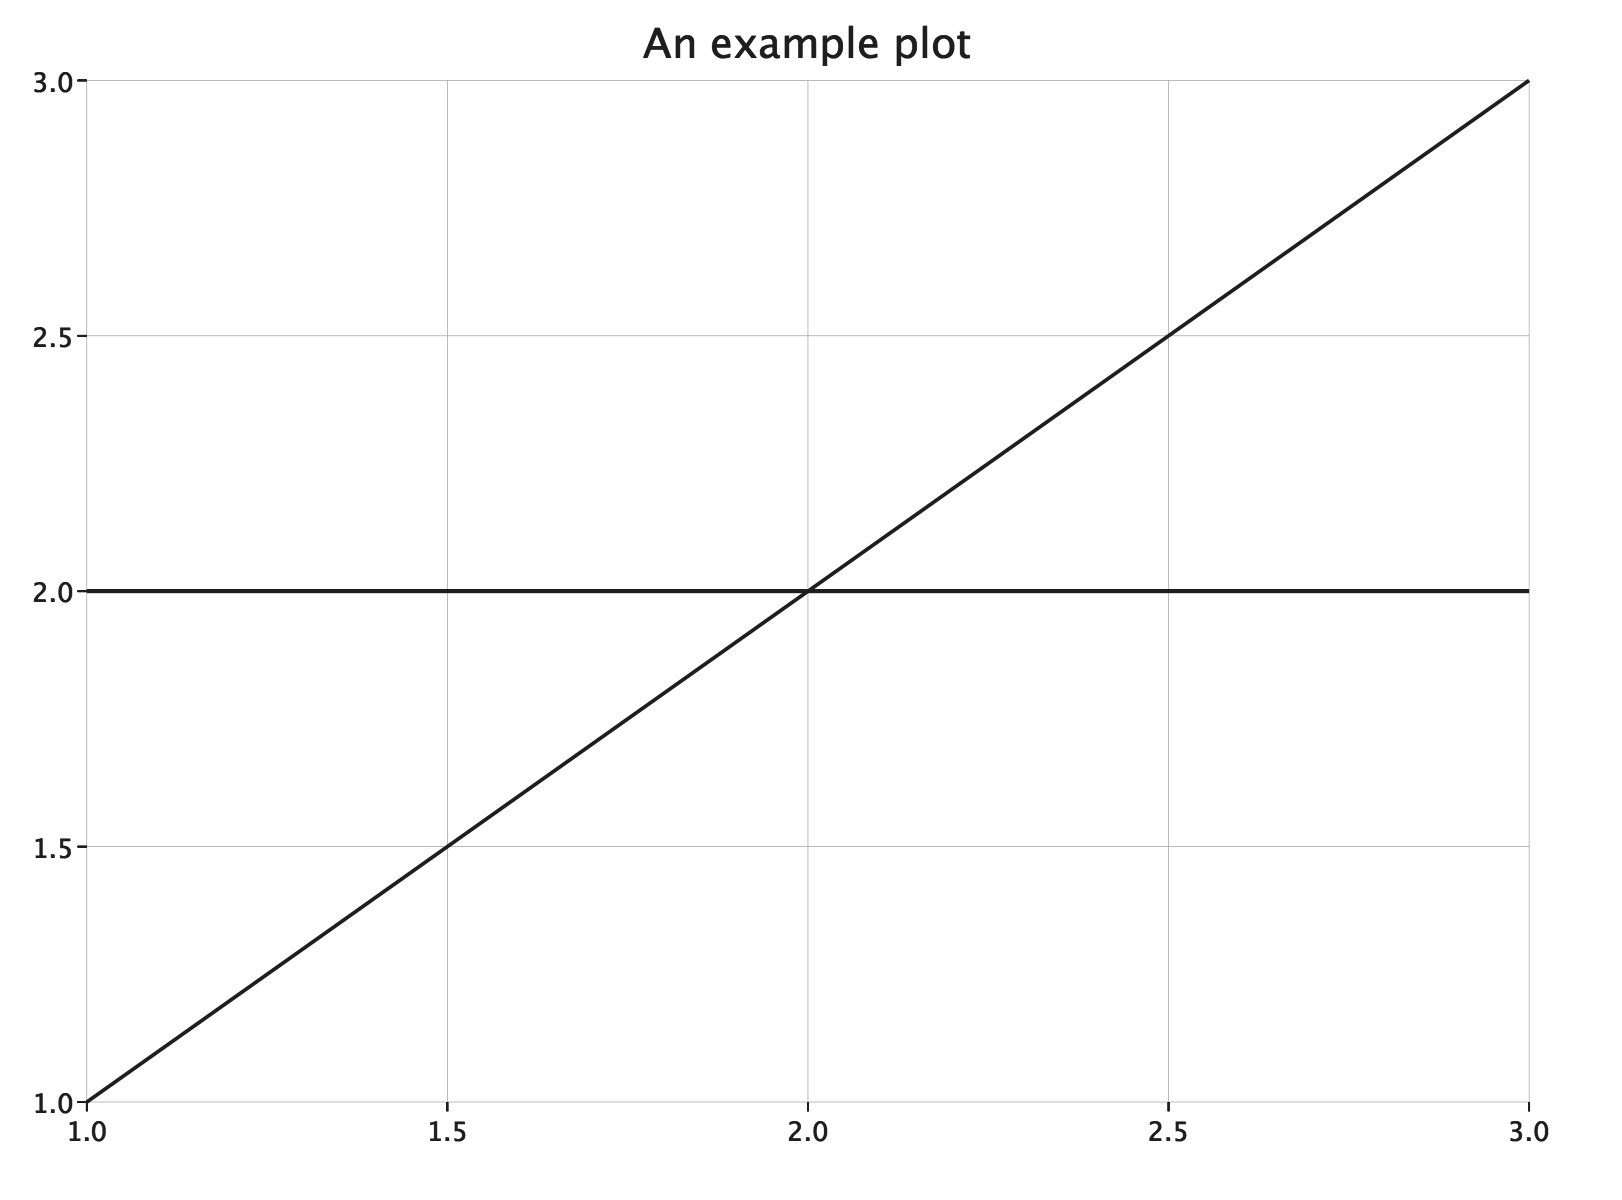
In this plot, xAxis, yAxis, xGrid, yGrid, hline, and title, all add plot components to the plot. You can
see the javadoc for all the built-in components
here by filtering for the “Implicits” traits.
Building a Custom Component
You can build your own components by extending plot.compoments.PlotComponent.
They are added to a plot using the plot’s component method.
Every PlotComponent instance has a Position indicating how it should be rendered relative to the plot.
- Position.Overlay
- The component occupies the same space as the plot and is rendered in front of it.
- Position.Background
- Background is similar to Overlay but is rendered behind the plot.
- Position.Left, Position.Top, Position.Right, Position.Bottom
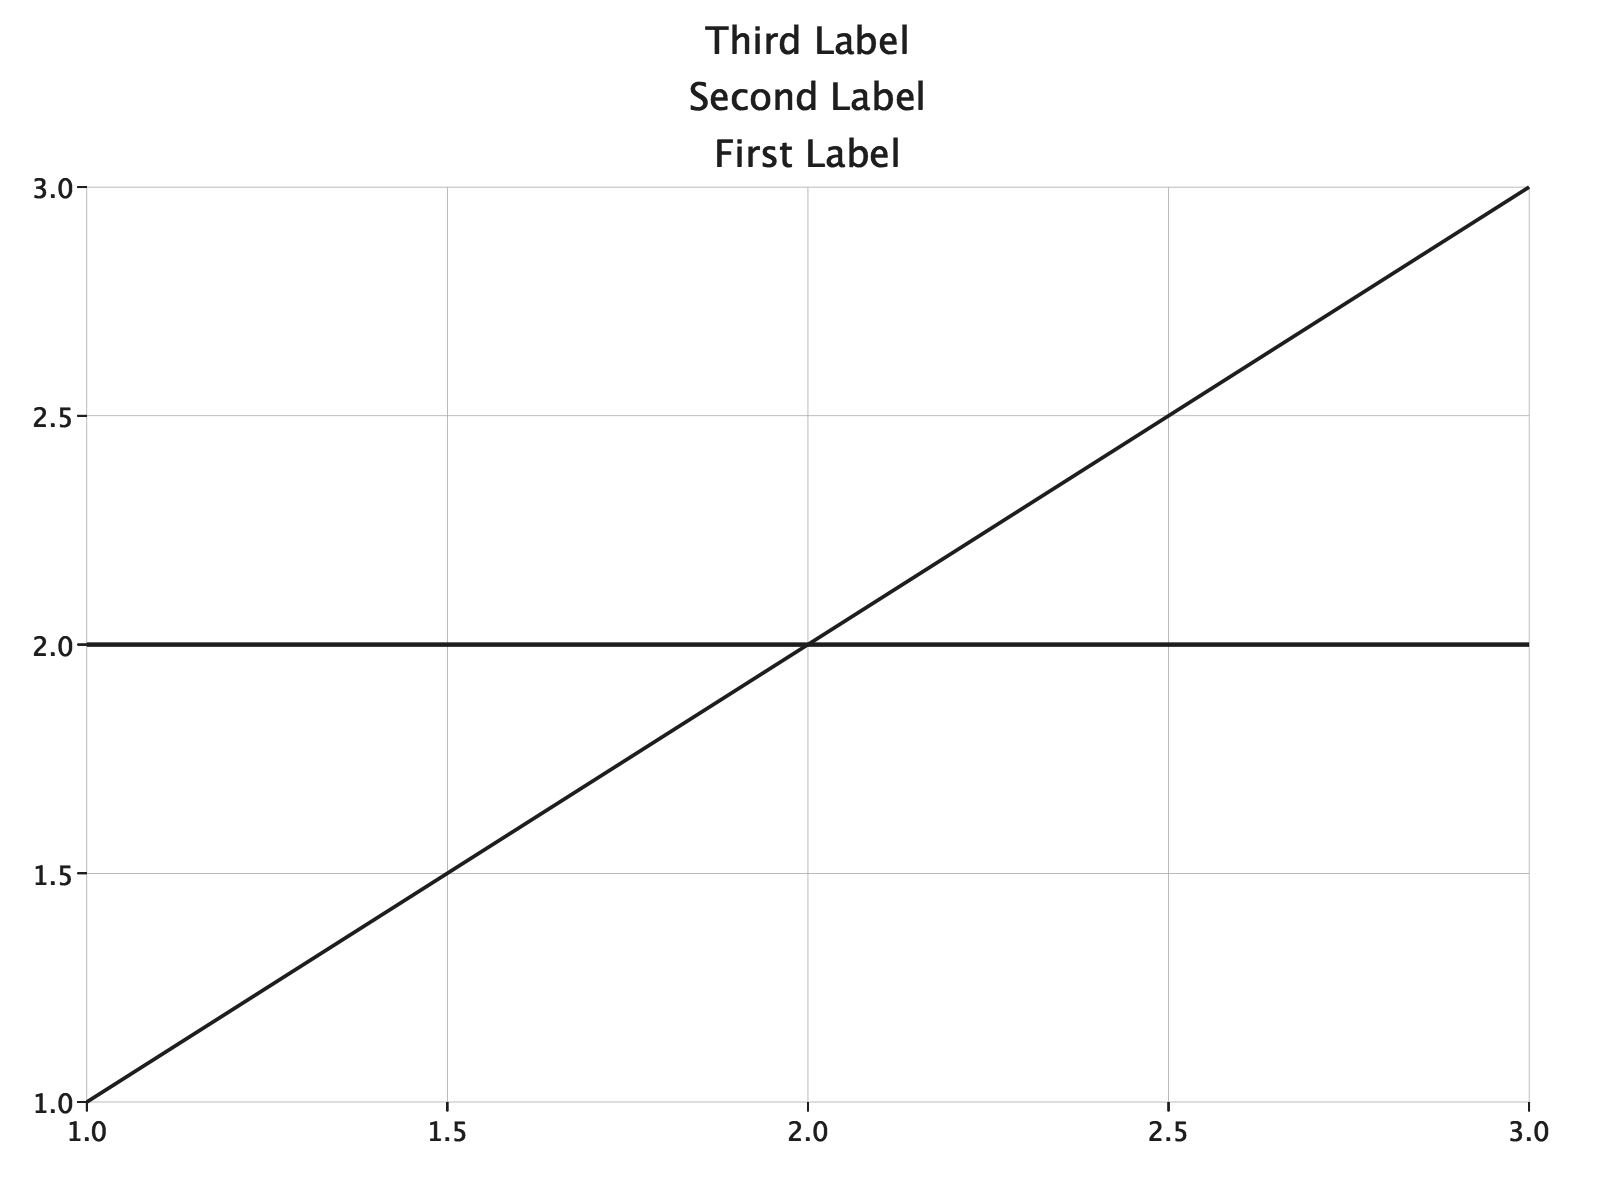
- Components with these positions are rendered outside of the plot space and placed next to the left, top, right, or bottom edge of the plot. Each component added at a position will be rendered outside previous components at that position (further from the plot). You can see this in the plot below where three Label components are added, all at Position.Top.
LinePlot(Seq(Point(1, 1), Point(3, 3)))
  .xAxis().yAxis()
  .xGrid().yGrid()
  .hline(2d)
  .topLabel("First Label")
  .topLabel("Second Label")
  .topLabel("Third Label")
  .render()
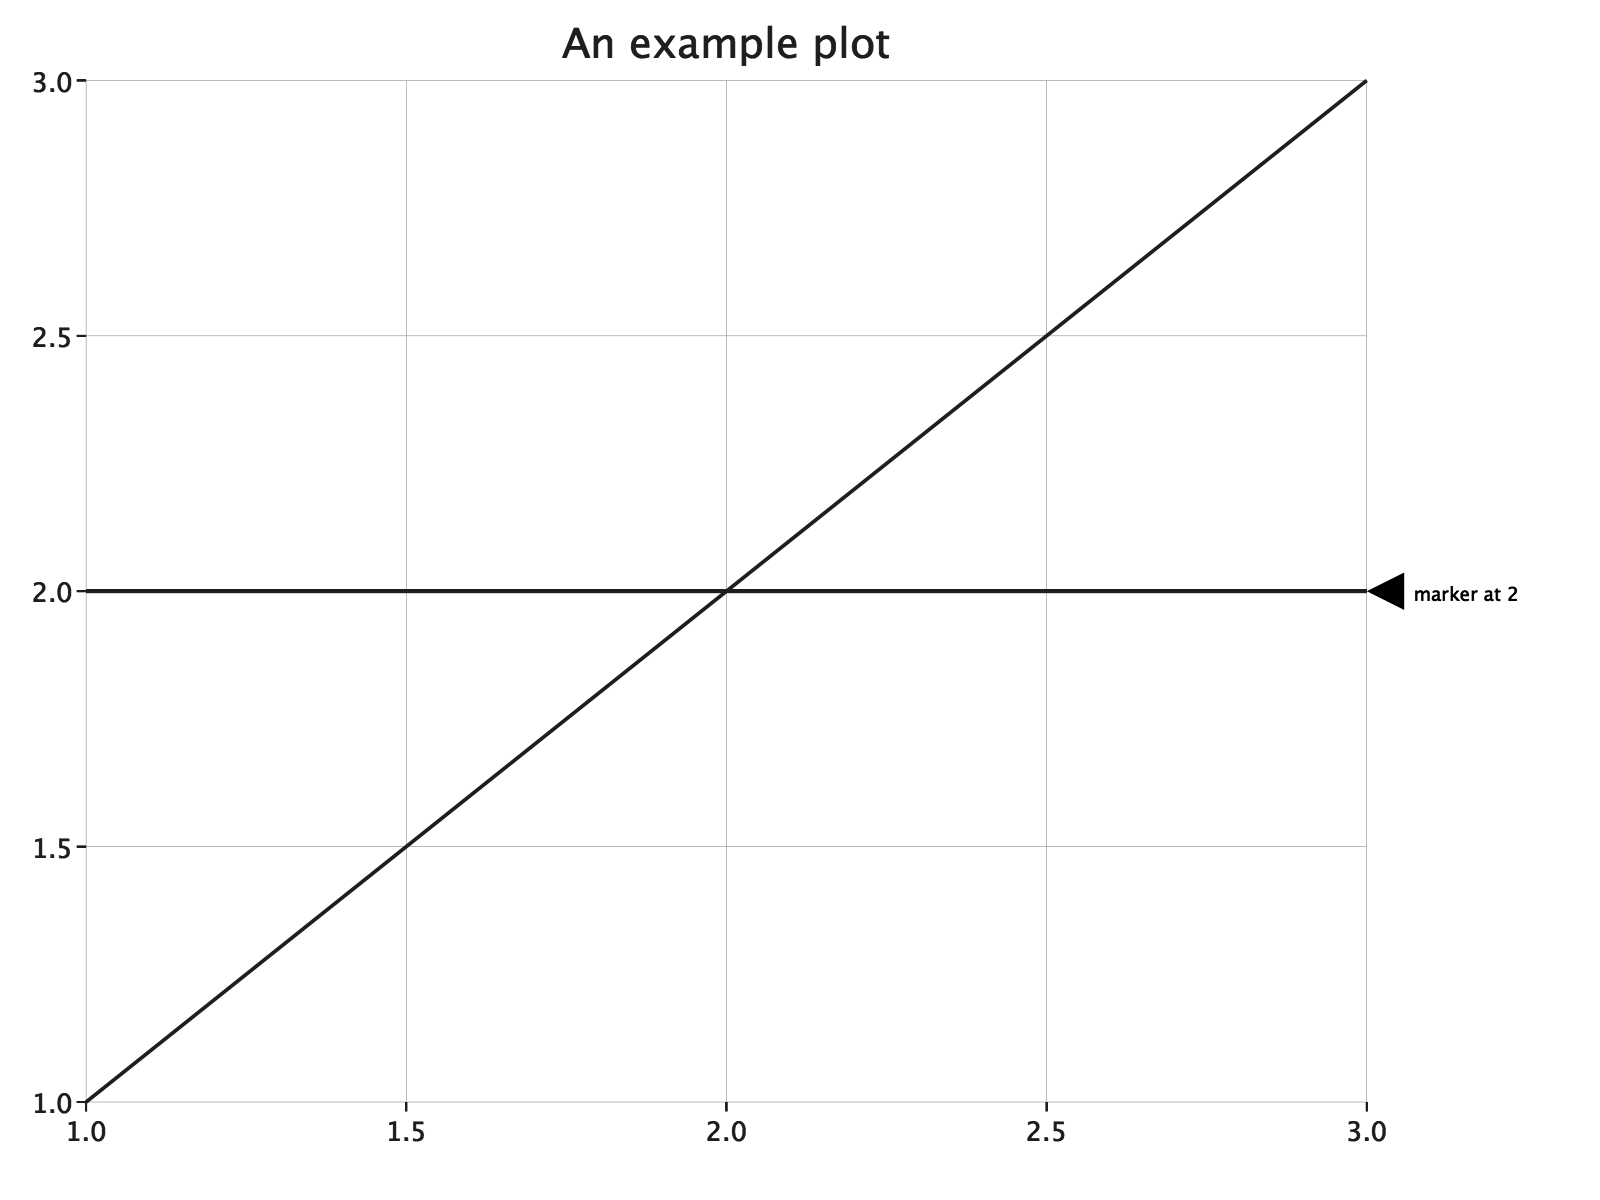
Here’s a sample custom component that adds a marker to the right side of our example plot.
import com.cibo.evilplot.geometry.{Align, Drawable, Extent, Polygon, Text}
import com.cibo.evilplot.plot.aesthetics.Theme
import com.cibo.evilplot.plot.components.{PlotComponent, Position}

case class RightSideMarker(
  msg: String,
  value: Double
) extends PlotComponent {
  val position = Position.Right

  private val triangle: Drawable = Polygon(Seq(Point(0, 0), Point(20, 0), Point(10, 20)))
  private val marker: Drawable = Align.middle(
    triangle.rotated(90),
    Text(msg).padAll(5)
  ).reduce(beside)

  override def size(plot: Plot): Extent = marker.extent

  def render(plot: Plot, extent: Extent)(implicit theme: Theme): Drawable = {
    val yoffset = plot.ytransform(plot, extent)(value) - (marker.extent.height / 2)
    marker.translate(y = yoffset)
  }
}
LinePlot(Seq(Point(1, 1), Point(3, 3)))
  .xAxis().yAxis()
  .xGrid().yGrid()
  .hline(2d)
  .title("An example plot")
  .component(RightSideMarker("marker at 2", 2))
  .render()